- Search Crypto Craft
- 17 Results
- vqs replied Feb 17, 2021
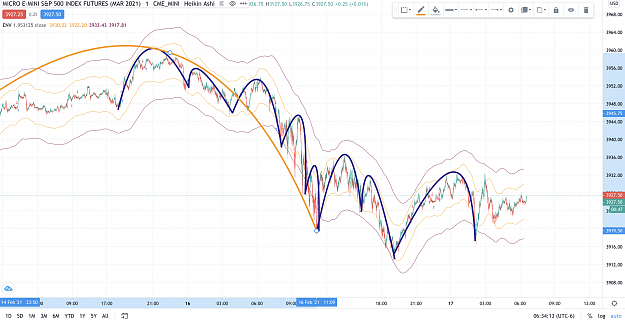
Hi Sir, Whats a correct method, or what is it that you use to identify/group the cycles (Orange & Blue Lines), is there a definitive method to do so? If I were to do it 10 times over, I would have done it differently and thus not having the ability ...
Analysis and Trading based on Envelopes, Waves, Cycles
- vqs replied Feb 15, 2021
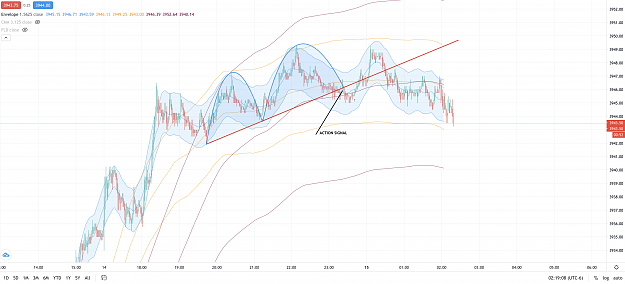
Good Morning Sir, image Here we have an Action Signal, but a short lived one, I'm missing out on what's wrong. Can you share what do you see in this chart that we can look out for to prevent opening such a position in the future? Regards VQ.
Analysis and Trading based on Envelopes, Waves, Cycles
- vqs replied Feb 10, 2021
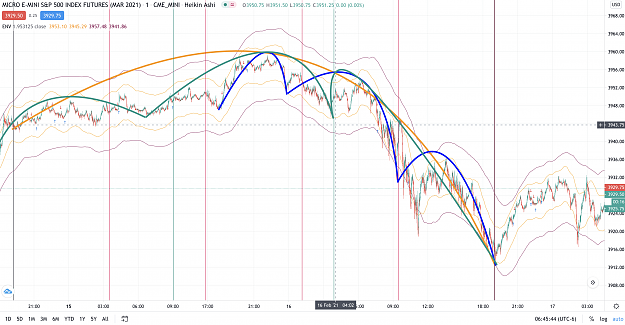
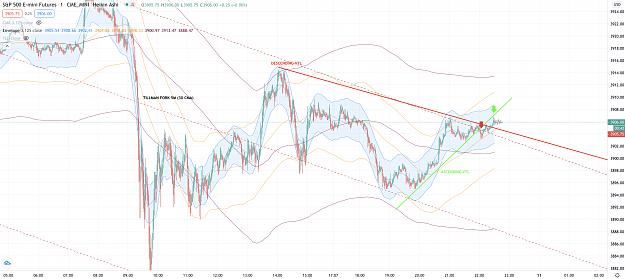
Good Morning Sir, I get this a lot, maybe if you could suggest a solution to this? Entry on 2nd/3rd Heikin Ashi (Reversal) from Top of Fork / Descending VTL but often reverses again and stops me out. image Regards VQ.
Analysis and Trading based on Envelopes, Waves, Cycles
- vqs replied Feb 8, 2021
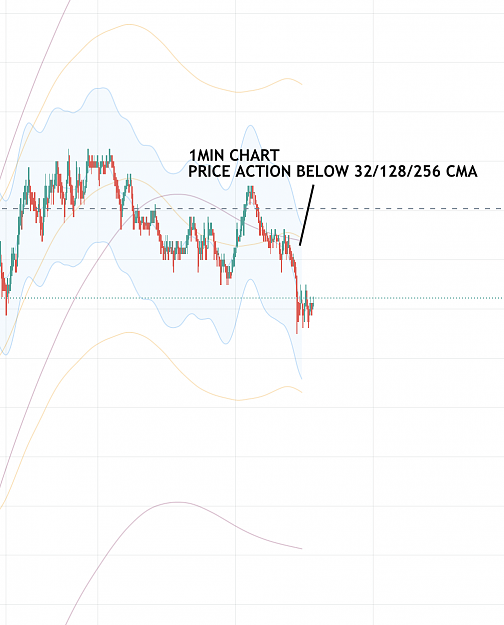
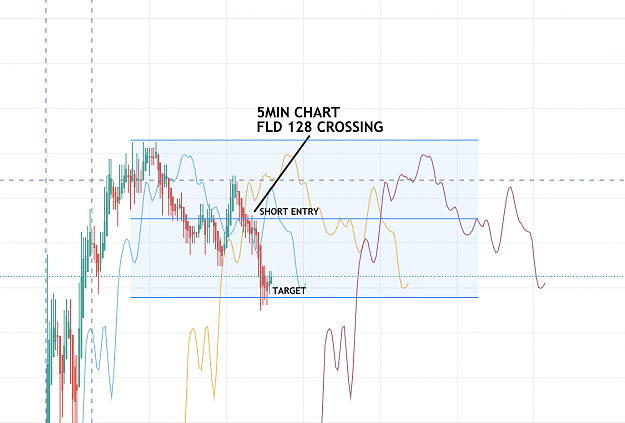
Hi Sir, Was unable to visually identify a cycle with envelopes (1MIN), saw that the merging CMA could act as potential resistance while also seeing a crossing of FLD (5MIN). Decided to take a position and it worked out. But I would hope if you could ...
Analysis and Trading based on Envelopes, Waves, Cycles
- vqs replied Feb 7, 2021
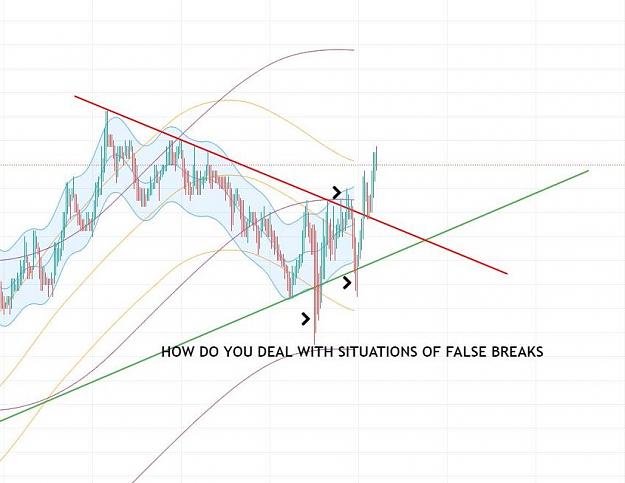
Hi Sir, image I noticed quick a bit of false moves all the time. How is a significant break defined by you Sir? Regards VQ.
Analysis and Trading based on Envelopes, Waves, Cycles
- vqs replied Feb 3, 2021
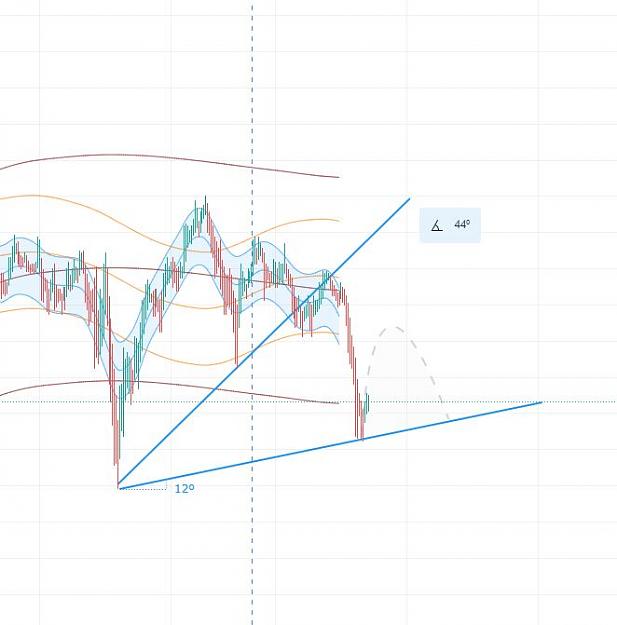
Hi Sir, image In the picture uploaded, we see a VTL 44 Degrees broken, and we have another low created. Can we allowed to view it as a new VTL? or do we need to have cycles above it to say it is a valid VTL. Since price is below the expired VTL ...
Analysis and Trading based on Envelopes, Waves, Cycles
- vqs replied Feb 2, 2021
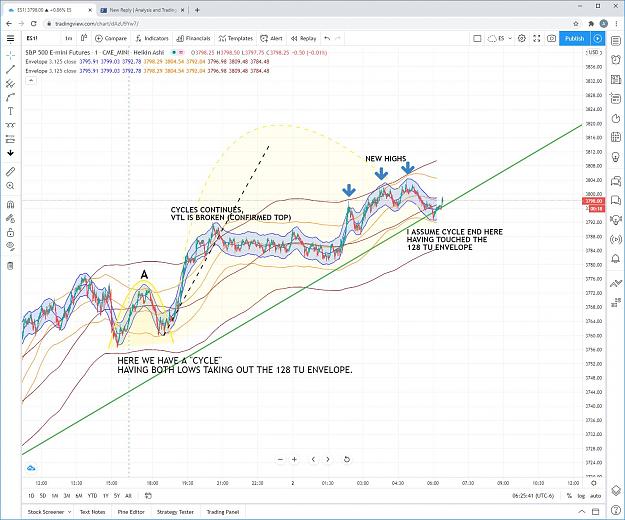
Thank You Sir, I have to ask again, if the cycle is continuous, we should expect a cycle of the same order (beginning from a 128 TU like in the picture, to continue and end once again on a 128 TU) but with a confirmed top we are putting new highs, ...
Analysis and Trading based on Envelopes, Waves, Cycles
- vqs replied Feb 1, 2021
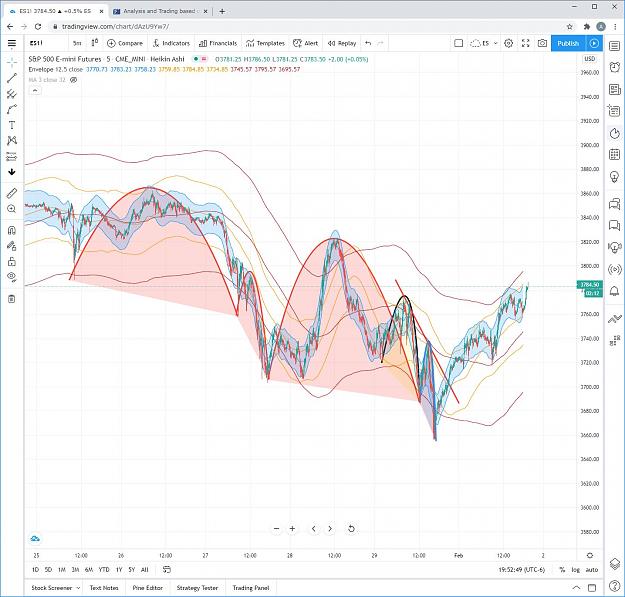
Second one, highlighted the one with a larger order. Please let me know if its correct. image
Analysis and Trading based on Envelopes, Waves, Cycles
- vqs replied Feb 1, 2021
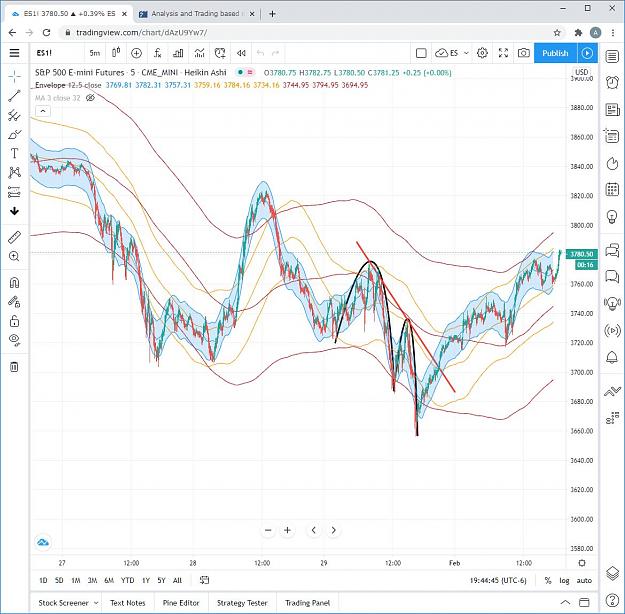
Greetings Sir, Does this way of identifying cycle that are of the same nature/order/degree looks right? image
Analysis and Trading based on Envelopes, Waves, Cycles
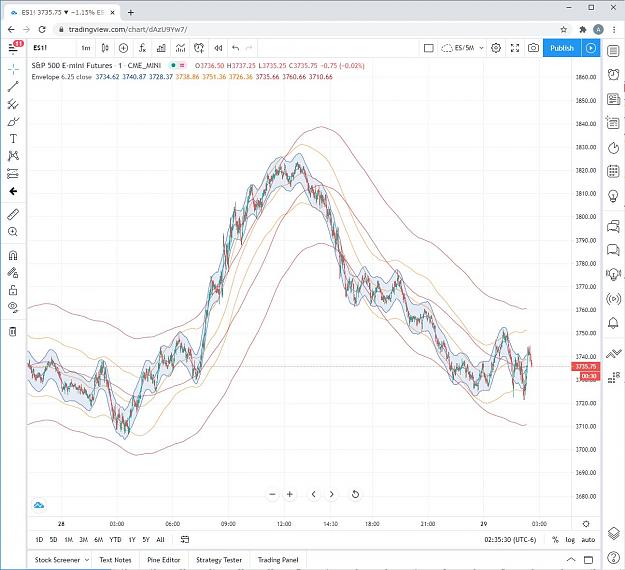
- vqs replied Jan 29, 2021
Hi Dave, I see where you're coming from. I'm just hoping to apply the concepts to a preferred instrument. I apologize if I'm asking too many questions. I just hope to progress in the right direction and that the more I study the more questions I ...
Analysis and Trading based on Envelopes, Waves, Cycles
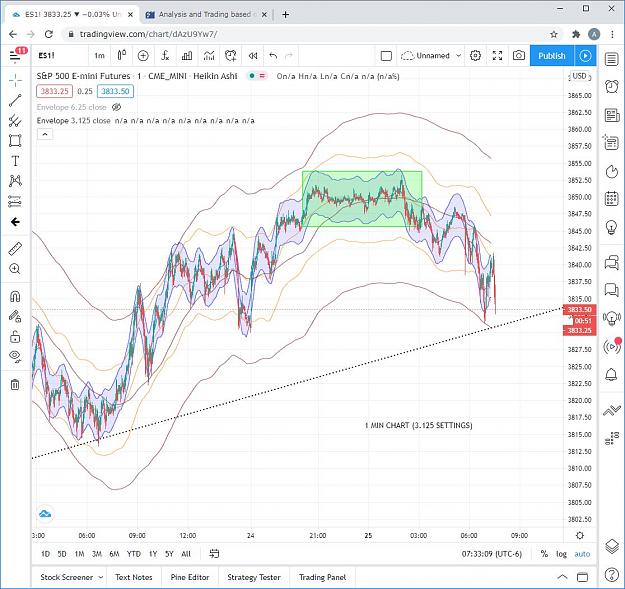
- vqs replied Jan 29, 2021
Greetings Sir, For this chart, cycles not too clear for me, I cannot clearly identify trend and such. If you can kindly show me how would you set it? image Regards VQ.
Analysis and Trading based on Envelopes, Waves, Cycles
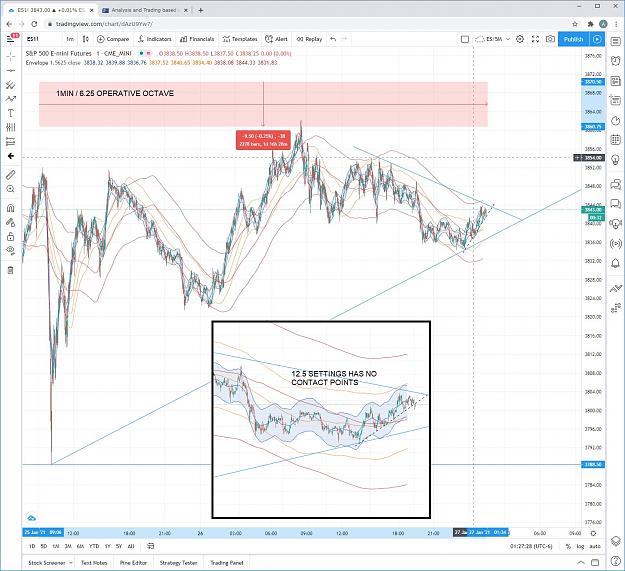
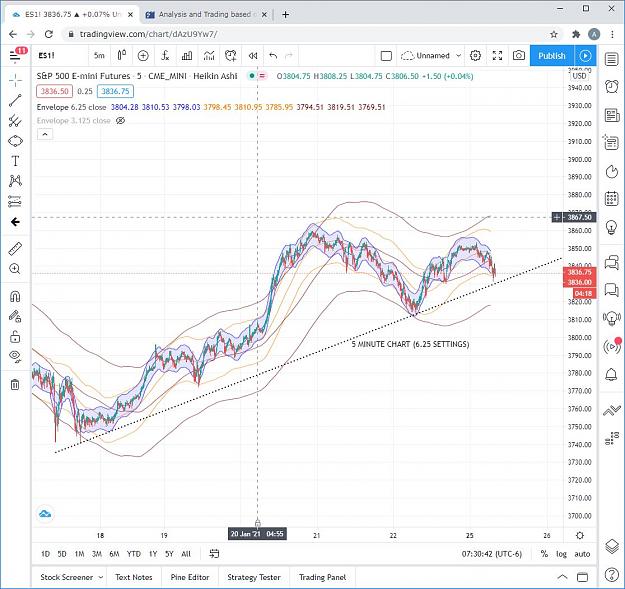
- vqs replied Jan 27, 2021
Hi Sir, If you may advice me how should I view the chart and it's trend. Am I looking to far back when attempting to connect the tops & bottoms? Operative octave used is 6.25 as 12.5 has no contact points. image Regards VQ.
Analysis and Trading based on Envelopes, Waves, Cycles
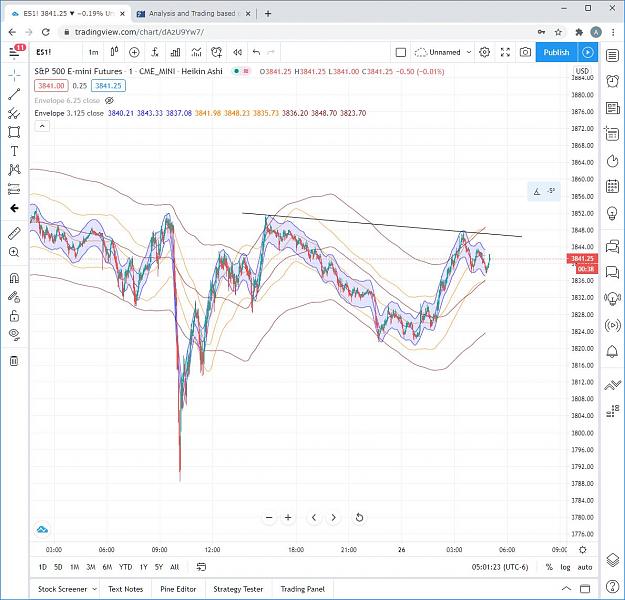
- vqs replied Jan 26, 2021
Hi Sir, image I've got more questions this morning. In this case a very mild Descending Valid Trend Line, no other VTL that I'm able to see. Is the trend flat or down, any sort of bias for such low degree trend? Another couple not relating the the ...
Analysis and Trading based on Envelopes, Waves, Cycles
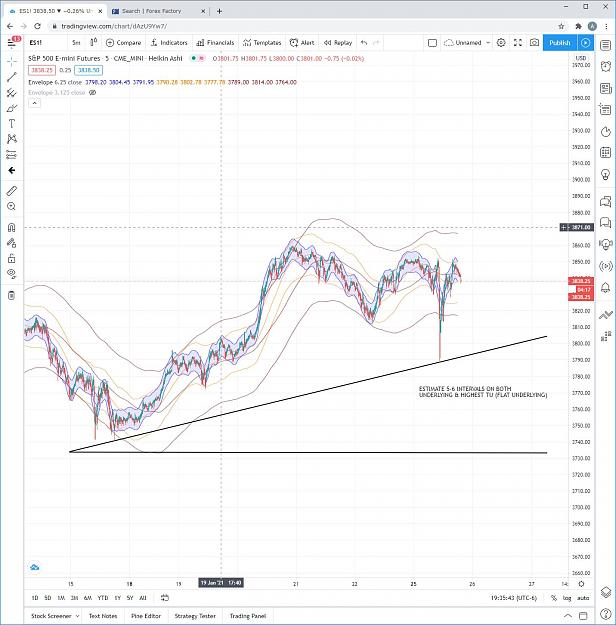
- vqs replied Jan 26, 2021
Hi Sir, as per pervious upload, does this correctly describe "lost motion" with regards to the flat underlying? image Regards VQ.
Analysis and Trading based on Envelopes, Waves, Cycles
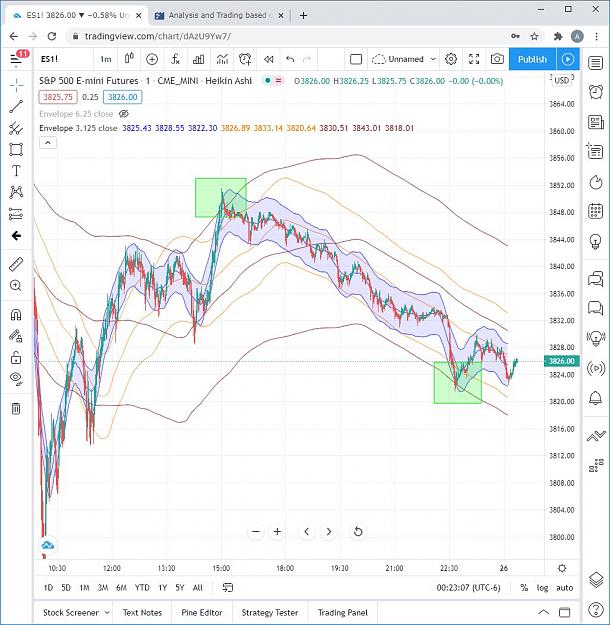
- vqs replied Jan 25, 2021
Hi Sir, in this scenario (attached image) where there is no significant underlying influence (intervals are almost equal), would the plan be to expect price be contained within the highest TU? image Regards VQ.
Analysis and Trading based on Envelopes, Waves, Cycles
- vqs replied Jan 25, 2021
Hi parisboy, thanks for the prompt reply. And I'm trying to grasp the concept of underlying, I've look at the pictures posted and I've been re-reading the definition of it but still not sure about it. My current understanding of it is (as per the ...
Analysis and Trading based on Envelopes, Waves, Cycles
- vqs replied Jan 25, 2021
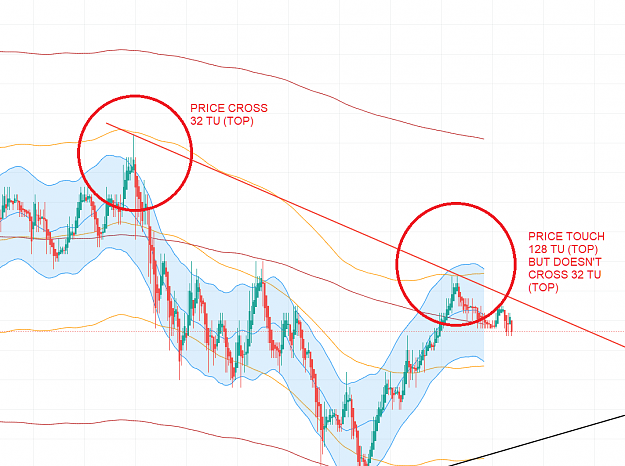
Hi parisboy, as per file uploaded. Would it be a Valid Trend Line, if price crossed/touched the 32 TU and subsequently cross/touched the 128 TU but not the 32 TU. Regards VQ.
Analysis and Trading based on Envelopes, Waves, Cycles
- Posts by Member Search: 'vqs'