- Search Crypto Craft
- 22 Results
- vik11 replied Dec 5, 2021
Again. massive appreciation for your help and education
Time and Price Forecasting I read a great deal of the thread when I was last here but forgot a lot of it, and of course much more has been added. After reading your post I studied the three posts you mentioned ...
- vik11 replied Dec 4, 2021
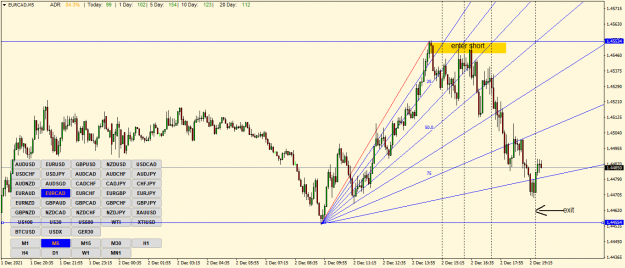
That's exactly my plan, Swede, integrate what I learned from ICT (although ICT certainly didn't invent it all, he just gave it different names) with angles. Using ICT terminology - valid order, mitigation, and rejection blocks all draw price back to ...
Time and Price Forecasting
- vik11 replied Apr 8, 2020
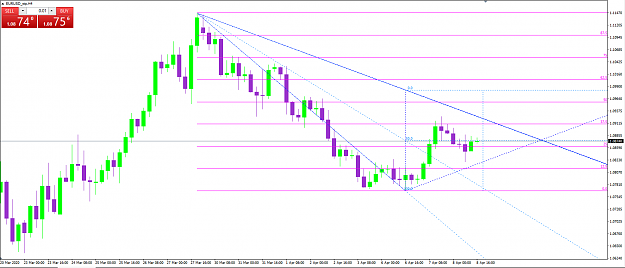
EU H4 is looking interesting. For a sell: Hovering on JSA 50. Doesn't seem to want to break away up to 37.5 octave. I'm short at 1.0880. SL above previous pivot high. TP 1.0770 Against a sell: that last pivot low could be the start of leg C If ...
Michael S. Jenkins teachings
- vik11 replied Apr 1, 2020
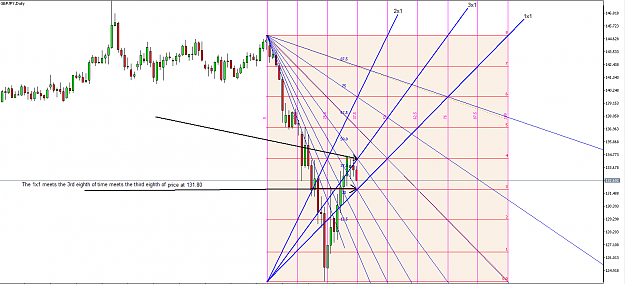
There's enough geometry going on here for me to have long positions on GBPJPY. Buy limit entries at 131.83 Target profits at 134.45, 137.05 and 139.74 Tight but breathable SLs around 130.50 1)The 1x1 meets the third eighth of time where the latter ...
Michael S. Jenkins teachings
- vik11 replied Mar 24, 2020
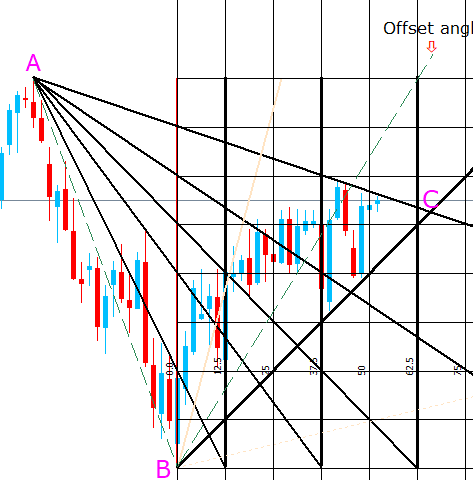
I use a plastic compass, as per Swede. I drew it on the chart here, in case you need to copy it quickly for a trade. I show the grid that could help you plot the 90 line. image
Michael S. Jenkins teachings
- vik11 replied Mar 24, 2020
The JSA does it again. Some retests and then off she sailed. I can't remember who said 'it doesn't get easier than this' - DM or Swede I think. image
Michael S. Jenkins teachings
- vik11 replied Mar 24, 2020
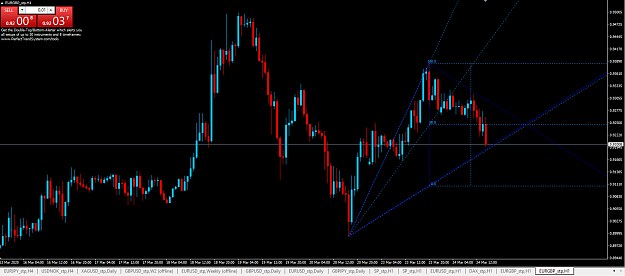
EURGBP with the JSA. On the 50 line now. Looks promising. Update - just crossed it with good momentum. We'll see. image
Michael S. Jenkins teachings
- vik11 replied Mar 20, 2020
They did, buddy. Just on a higher timeframe for entry etc. Once it broke 50 on HI we got 200+ pips. Good call on your part, Faraon. image
Michael S. Jenkins teachings
- vik11 replied Mar 20, 2020
Looking good in terms of rejection at 50 on M15. image If it breaks down the 50 on H1 maybe a big move short. To my way of thinking anyway. image
Michael S. Jenkins teachings
- vik11 replied Mar 18, 2020
Following on from my earlier post url Beautifully simple thanks to MSJ and those making his teachings available here image
Michael S. Jenkins teachings
- vik11 replied Mar 18, 2020
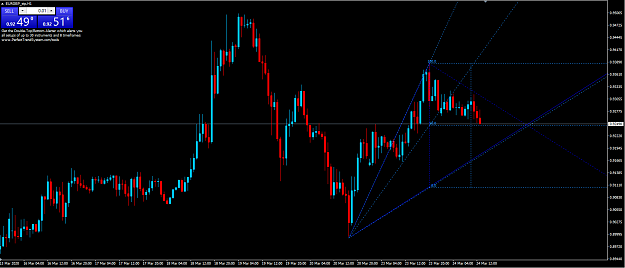
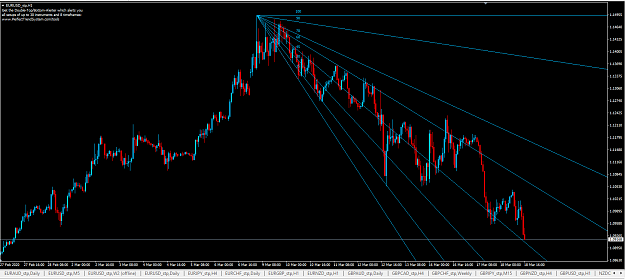
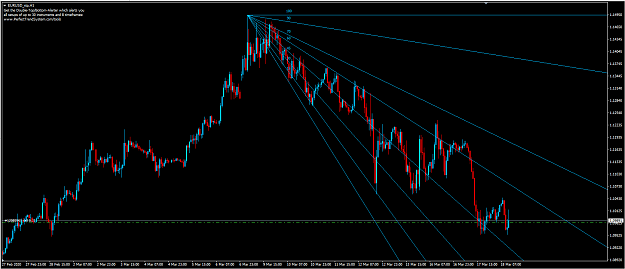
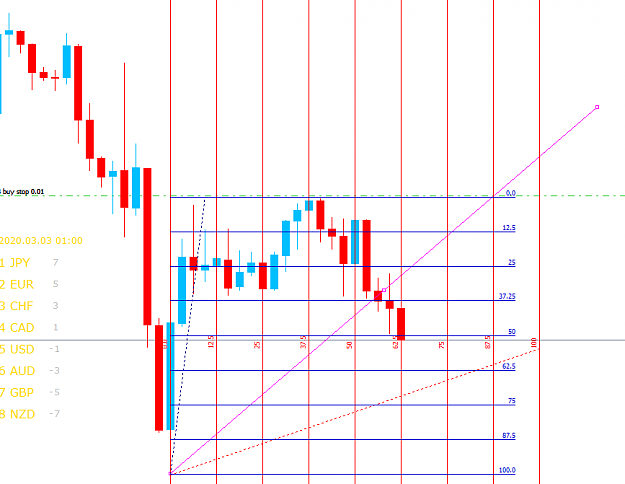
Extrapolating from Swede's chart posted earlier ( url ) with fan angles on EU H1, and also looking at D1 with time price squared and 90 degree offset angle from previous down move, I'm thinking it might head down to around 1.0917. May not move that ...
Michael S. Jenkins teachings
- vik11 replied Mar 13, 2020
image Closed all positions when it hit the 75 fib octave for 40 pips. EU still going south when I last looked but that will do me for today. My next TP was 1076 on the 82.5 (it just hit it) And then 100 to match the previous bottom at 1.1054 All ...
Michael S. Jenkins teachings

- vik11 replied Mar 13, 2020
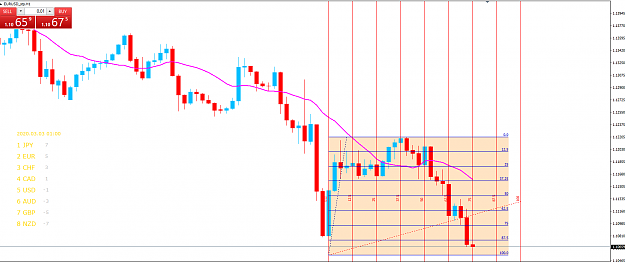
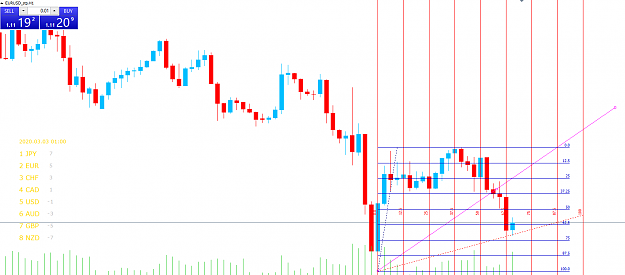
Time about to meet price at 62.5. Big move imminent? Is this last move a fakeout from the range, ready to reverse and go high at 62.5? Or is it going down? H&S on H4 image
Michael S. Jenkins teachings
- vik11 replied Feb 18, 2020
I just realised there is also a very nicely proportioned triangle that will have to be broken at the same time, or thereabouts - I've labelled it for easy viewing image
Time and Price Forecasting
- vik11 replied Feb 18, 2020
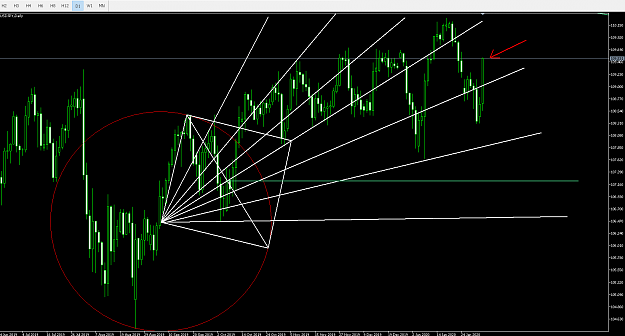
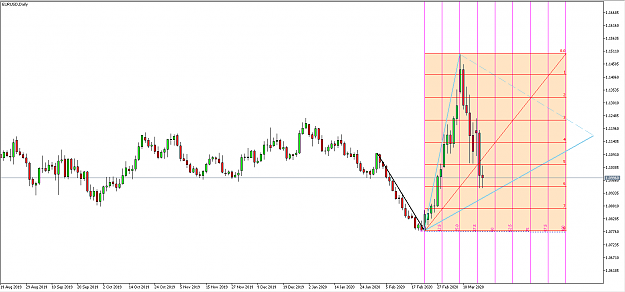
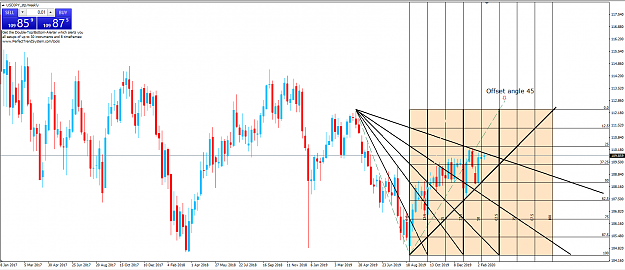
USDJPY - looking at the weekly. I drew a square using octave numbers for both time and price to square it. Drew some angles off the down move, and interesting to see where they intersect with the low is exactly at major VTLs. Now that may be a ...
Time and Price Forecasting
- vik11 replied Feb 14, 2020
I've been studying MSJ all last week and this every chance I had. By early this evening I still felt as though I had no grasp on the big picture. Little bits made some sense, but nothing that I could put together on a chart and use to actually ...
Time and Price Forecasting
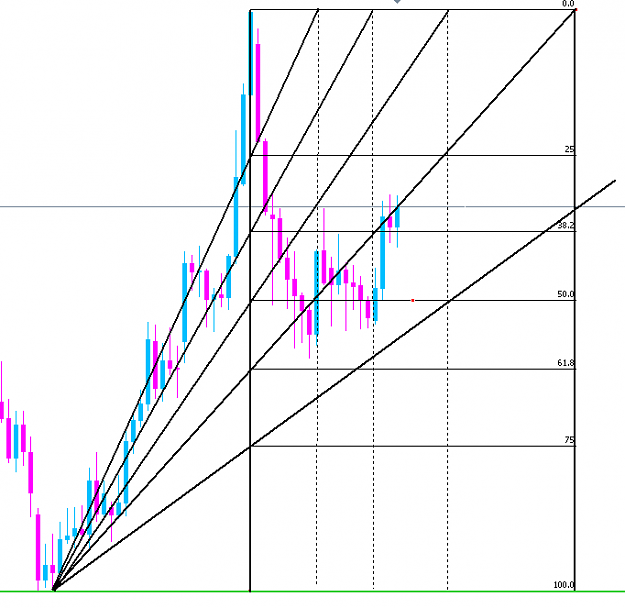
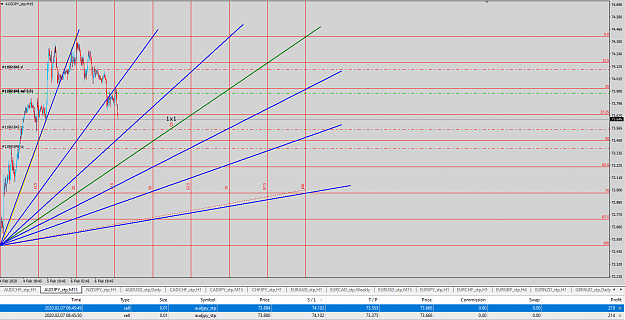
- vik11 replied Feb 7, 2020
I spent too much time trying to work out how to get past the scaling problem and construct a grid with an accurate 45 degree angle. Sorted it out in the end by using fib retracement and fib time zone tools on MT4. Used angles of 25, 50, 75 etc, as ...
Time and Price Forecasting
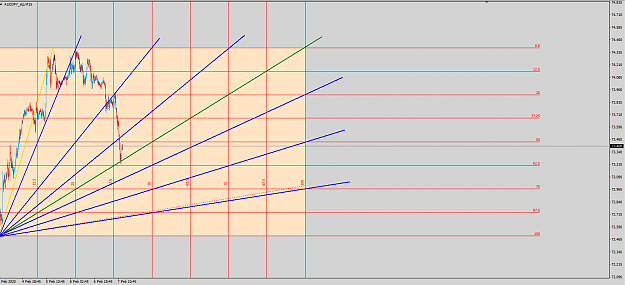
- vik11 replied Feb 4, 2020
Not sure what I was looking at last night. There are a whole lot of higher highs and higher lows there, and price crossing above angle lines and on to the next angle line above. Even if that's only a correction of the monthly and weekly downtrend, ...
Time and Price Forecasting