- Search Crypto Craft
- 50 Results
-
 ud1nh0 replied Apr 12, 2014
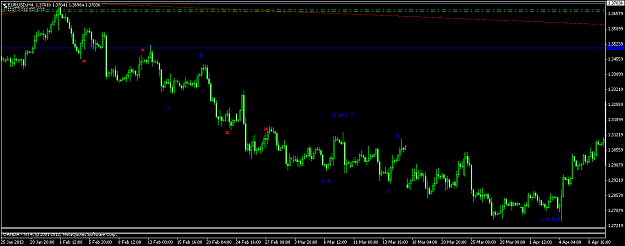
image image no worries, tripple xxx has possibility to be completely retraced.
EURUSD
- ud1nh0 replied Feb 11, 2014
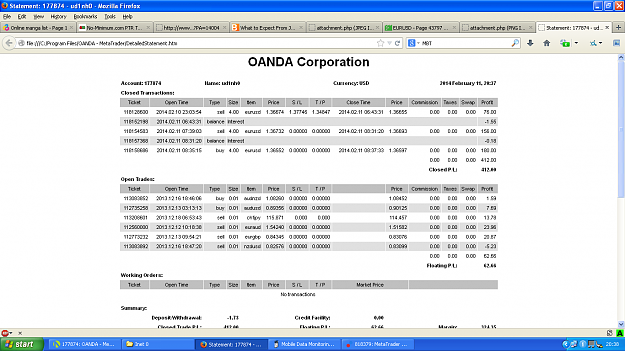
making demo money is not required to have understanding complex indicator. just candle rite... this one i use candle toss coin.. still, im not good at real money, not like u that has green income in siggy.
EURUSD
- ud1nh0 replied Jan 11, 2014
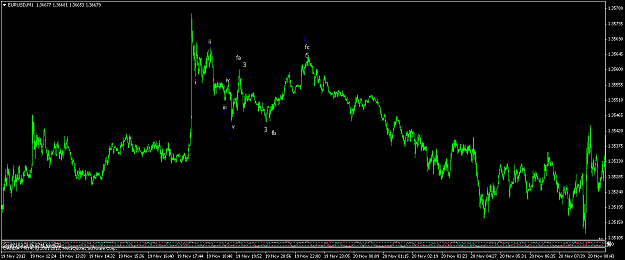
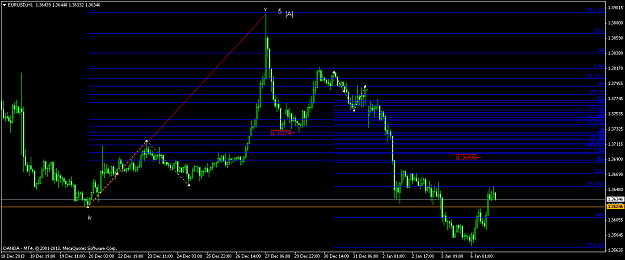
heres...there's a wave iii above 1.76 its on the first segment [1]
Elliott Wave Trading
- ud1nh0 replied Jan 10, 2014
check it out. not sure if its true the use of expansion testing...
Elliott Wave Trading
- ud1nh0 replied Jan 8, 2014
this occurs on movement more than 100 % but movement should be trending 5-3-5 experimental chart labelling. a always 5 c always 5 c should not go more than 100 of a i don't know how much possible extending can happen, rite now following max 2. if ...
Elliott Wave Trading
- ud1nh0 replied Jan 7, 2014
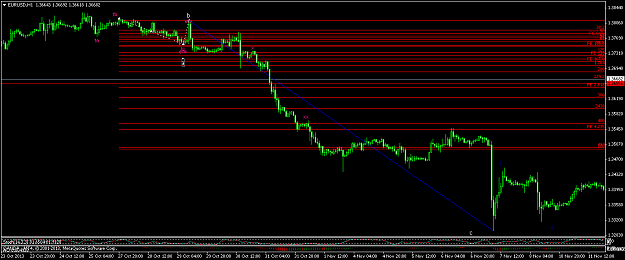
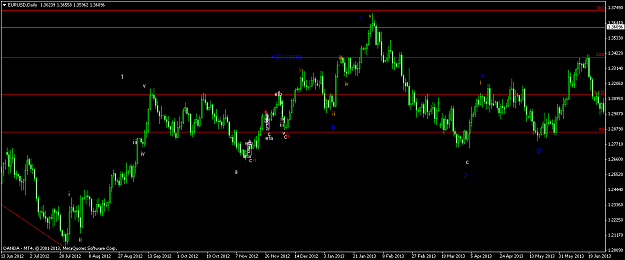
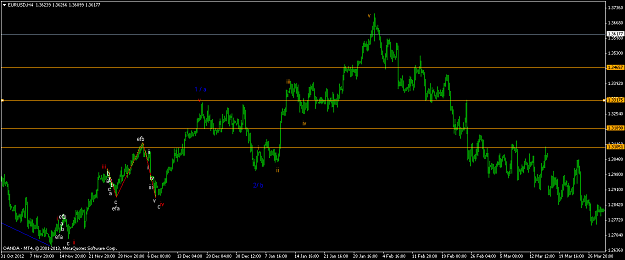
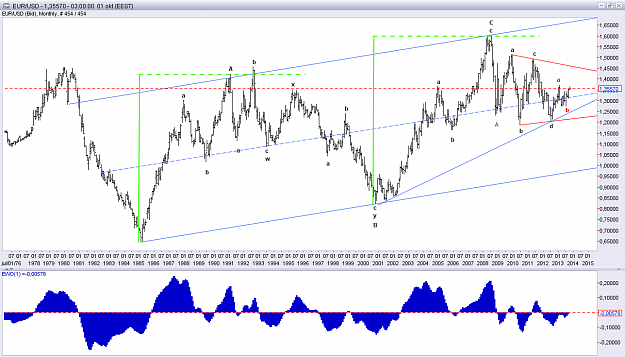
first problem, downward from 1.4750 till 1.2050 is impulsive...its a c wave. 2nd problem, upward move from 1.2050 till 1.317x is impulsive then a corrective that break previous small 4. third problem, c wave white should be impulsive.. i follow rule ...
Elliott wave outlook
- ud1nh0 replied Jan 7, 2014
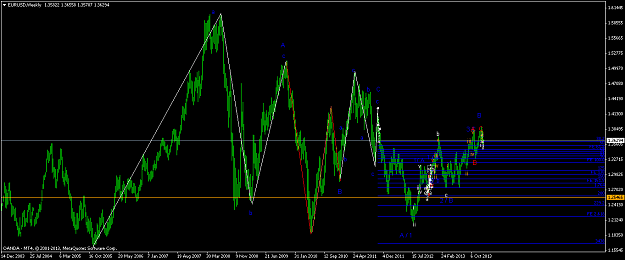
i see but no 0.96 this chart was randomly labelling for coz its complex. especially downward 3710 till 27xx. i can't dechiper it as a c wave.
Elliott wave outlook
- ud1nh0 replied Jan 7, 2014
i have updated the count on the last minute. yes ian, that depends on how we label the wave. i am testing rules. basic still same at first page. the rules is not proven yet. btw i see this as 5-3- now. expecting to fill gap in chart before further ...
Elliott Wave Trading
- ud1nh0 replied Jan 6, 2014
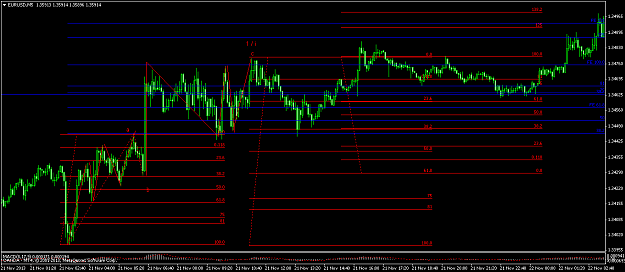
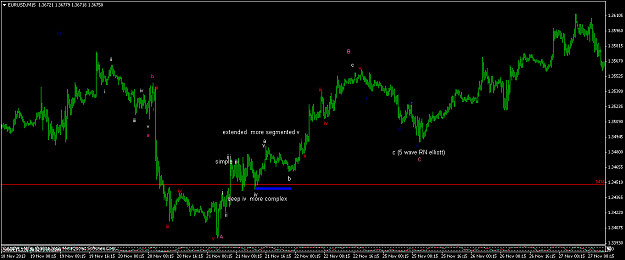
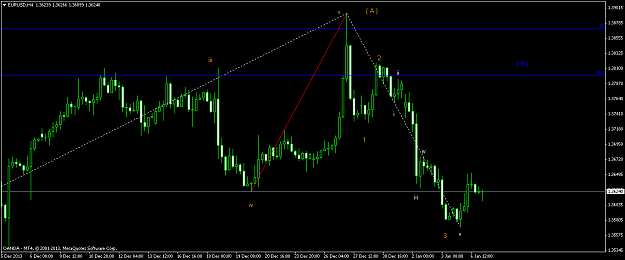
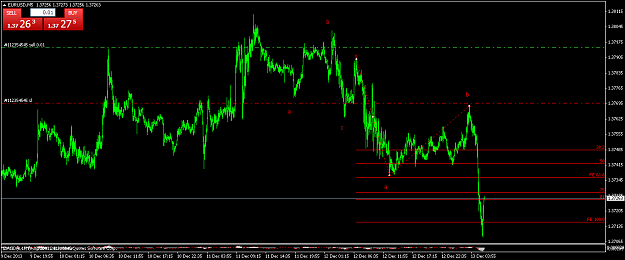
fifth wave done hypotesis. reason : -theres no -c- that move 2.618 of -a- (source wikipedia max 200) - it become 1 simple segment - no kiss 1.361x before break high - 3 wave move complete. with 1.3710 inside the third stroke down if this price break ...
Elliott Wave Trading
- ud1nh0 replied Jan 5, 2014
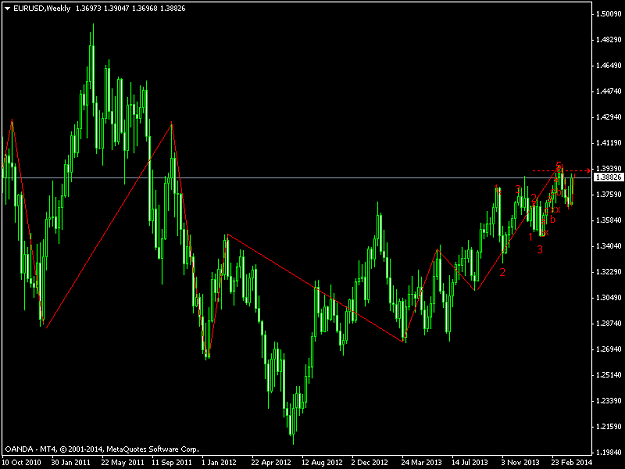
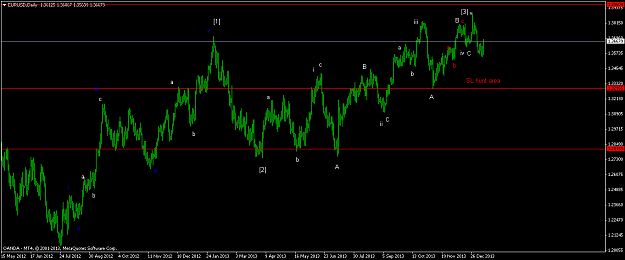
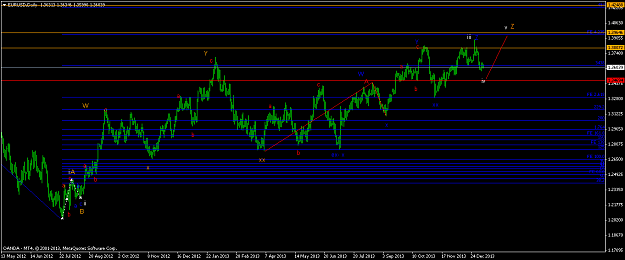
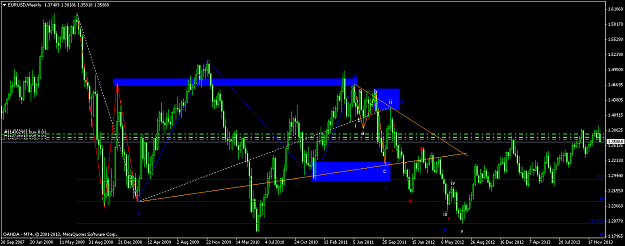
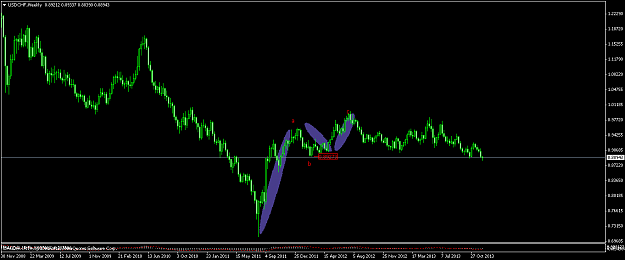
hey PT, seems like trend reversal.. this is my weekly chart for long term triangle analysis detail: its very clear the upward movement after 1.60 sell off is in 3 segment. next downward would be a c coz it did not beat the low 1.23xx thus i copy PT ...
EurAnalysis
- ud1nh0 replied Dec 10, 2013
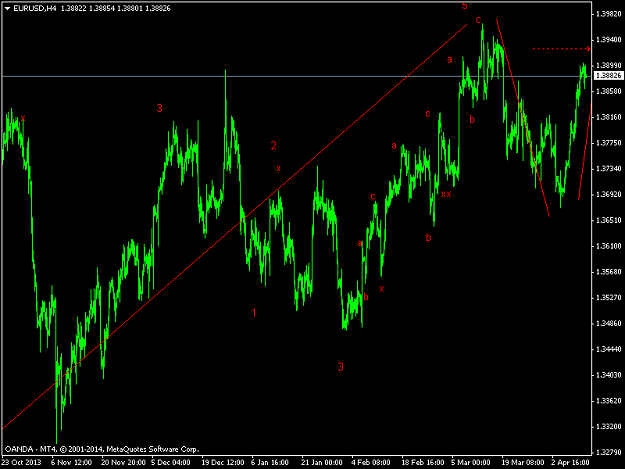
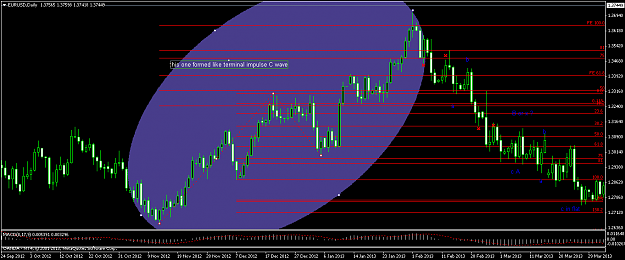
added chart, please correct me if its not terminal impulse or edt. and tell me reason.. edt formed 3-3-3-3-3 or random?
Elliott Wave Trading
- ud1nh0 replied Dec 8, 2013
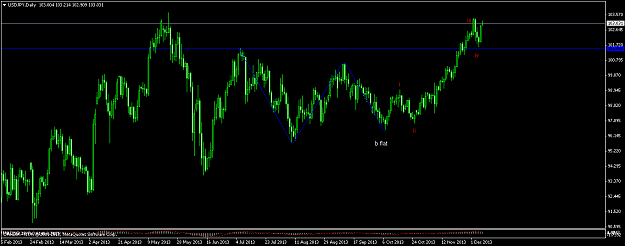
uj , i only identified a b flat edit: added furthermore
Elliott Wave Trading
- ud1nh0 replied Dec 8, 2013
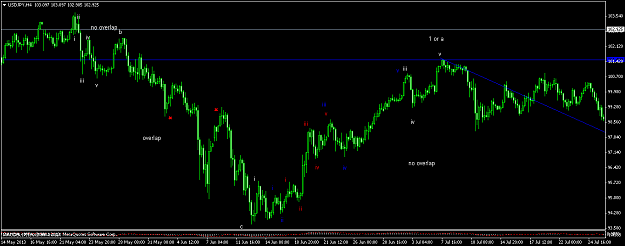
this one i try to label that red cross is overlapping mark
Elliott Wave Trading