- Search Crypto Craft
- 15 Results
-
 tsidki replied May 20, 2011
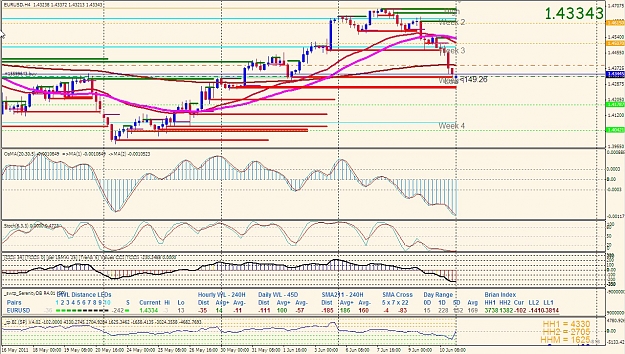
EURUSD please see this chart as 1.4222 is the most repeated number according to PA in the last 30 days also price couldn't break it for 3 previous attempts and now is the forth attempt and it didn't break it so it's seems to be a good place to go ...
- tsidki replied Apr 20, 2011
Good Morning, In my opinion we are going to test 1.448x as we could get a rejection there if broken next one will be 1.4512 i'm in for buy at 1.44077 tp 1.4446 sl 1.4381as for scalp regards tsidki.
EURUSD
- tsidki replied Mar 18, 2011
hello all, first position of my pending orders is activated and hit the target of +70 pips that i was posted it on page 27252 post #408771 Mar 17, 2011 2:27pm (23 hr ago) first pic and my new pendings on the secound pic and those are not a signal ...
EURUSD
- tsidki replied Mar 17, 2011
those lines are fixed fibonacci levels not like a grid sorry the pic is not clear for you i'll try to make it clearer sorry for that or try to open the pic in a new window it will be clearer those are the first 2 pindings and the others i cant show ...
EURUSD
- tsidki replied Mar 17, 2011
hi guys, those are my pendings on the chart good luck for all tsidki
EURUSD
- tsidki replied Mar 7, 2011
image hi, IMHO on the down side if we break 1.3920 we will go to 1.3875 then 1.3805 and for the up side if we break 1.4080 we will go to 1.4137 then 1.4215 and i'm now on buy from 1.3988 tp 1.4058 sl 1.3938 and this is not a signal this is just my ...
EURUSD
- tsidki replied Aug 21, 2008
hi guys, we have 2 IB on GU and EU we need a break to the upper side now. regards tsidki.
The DIBS Method... No Free Lunch continues
- tsidki replied Aug 19, 2008
this is my chart settings as I use the same settings as jaroo based on my time zone +2. also I use the S_R indicator to make it easy for me to directly spot the Supply/Demand or Suport/Resistance areas and if u notice price just retrace from the red ...
The DIBS Method... No Free Lunch continues
- tsidki replied Aug 15, 2007
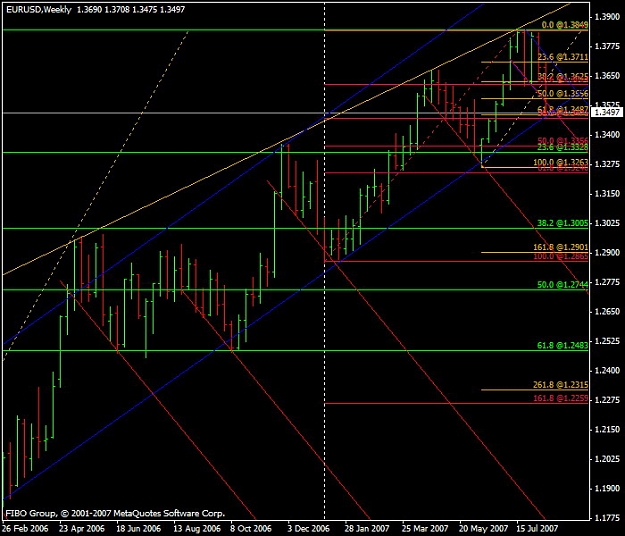
We alikom alsam Ahsan, this was logicaly good according to Triple A Method and I agree with you the next signal should be long but it will not be a full winner as to this weekly chart of the eur/usd it had to make two more downtrend weeks as it ...
Triple A Method
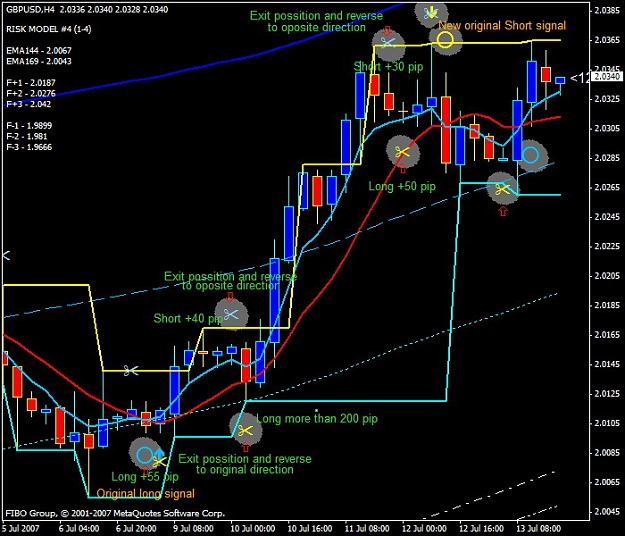
- tsidki replied Jul 13, 2007
Hi ahsan, Your system is great as it is, even with my first trade with it was bad , It gives a very good entry sign and a good filling of the Market direction and very simple to follow but the exit point need to be improved And this what I'm trying ...
Triple A Method
- tsidki replied Jul 13, 2007
This is the pic as I have to change it's formar to jpg to upload it
Triple A Method

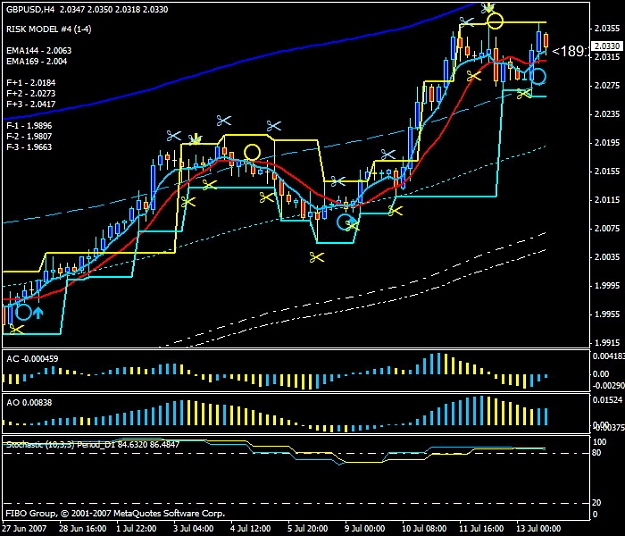
- tsidki replied Jul 13, 2007
Ahsan check this indicator we could use it as exit point and then reversal and so on I made some modification on it like changing the arows type and size its normal period was 10 I change it to 3 to be more flixble Regards Tawfik
Triple A Method
- tsidki replied Jun 29, 2007
I use ACM as broker and FIBO group demo account to use MetaTrader 4 build206 as chart. but there is some thing different in my chart check the attachment with yours please specialy in curves regard
TEB sytstem

- Posts by Member Search: 'tsidki'