- Search Crypto Craft
- 38 Results
-
 thegrimreape replied May 27, 2020
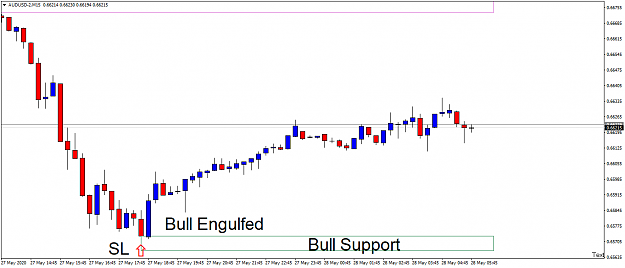
This is how I trade. Minimal drawdown, successful entry and has always been consistent for many years.
"Bullish Engulfing Bar" and "Bearish Engulfing Bar" trade
- thegrimreape replied May 24, 2020
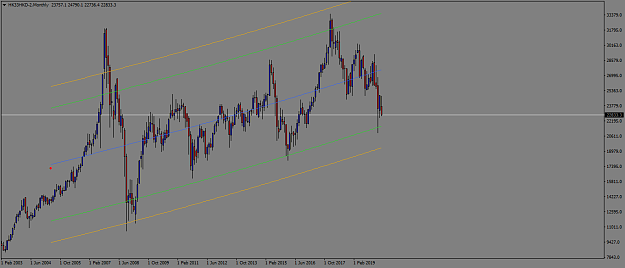
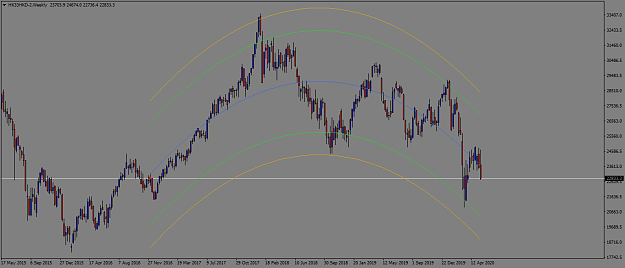
Zero harmonization from the top to the bottom. If you read the news, I am sure you came across various sources chipping on Hong Kong's pro-democracy movement. Can the uproar be good for the economy? Of course not. But, did the Monthly agreed all the ...
Center of Gravity Daily Trend Trade
- thegrimreape replied May 24, 2020
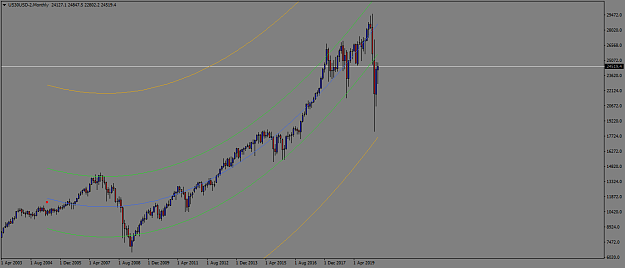
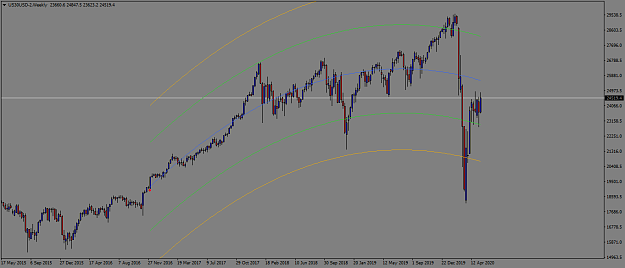
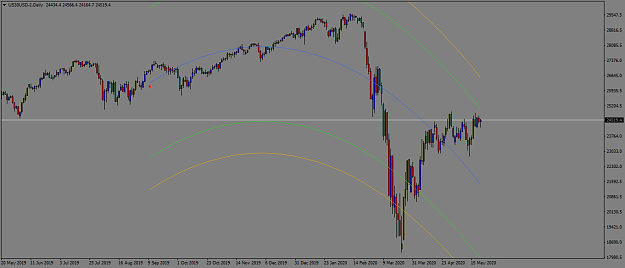
What about the infamous US30? Way too indecisive for the Monthly's bull!
Center of Gravity Daily Trend Trade
- thegrimreape replied May 24, 2020
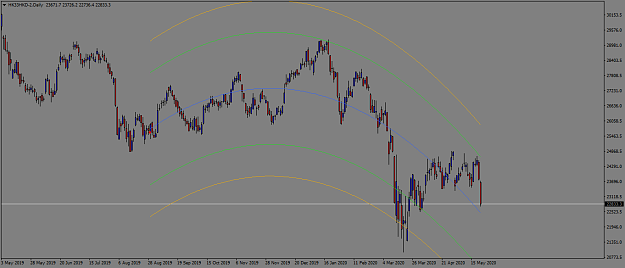
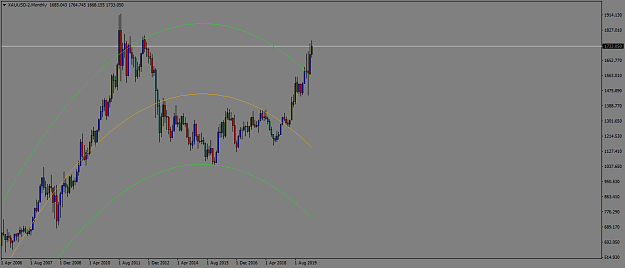
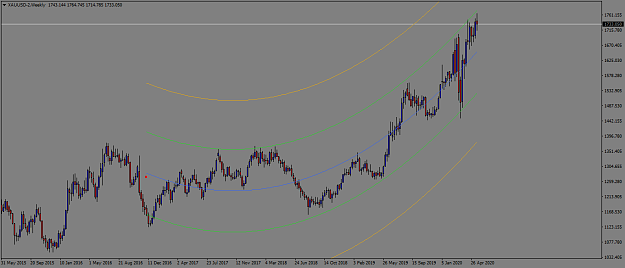
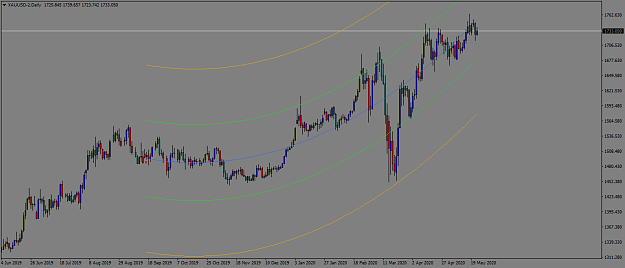
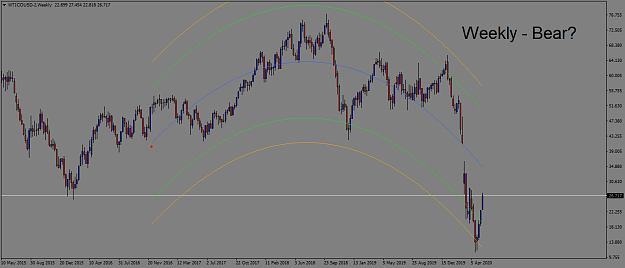
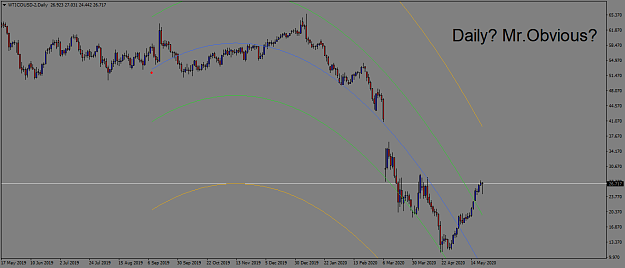
This is why I don't dig this trade. Monthly were bearish, but what's with the Weekly and Daily timeframe? Bullish! Should I enforce a buy even though Monthly isn't following the Daughter (Daily Timeframe) and the Wife (Weekly Timeframe) to the ...
Center of Gravity Daily Trend Trade
- thegrimreape replied May 24, 2020
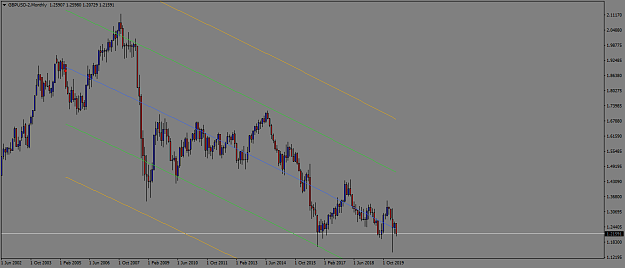
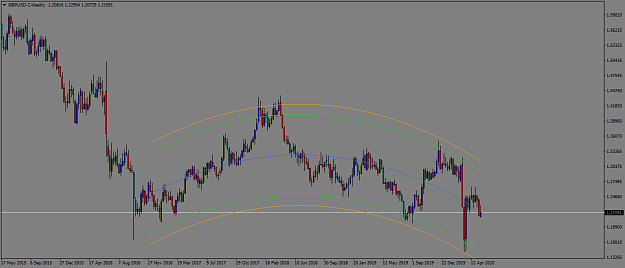
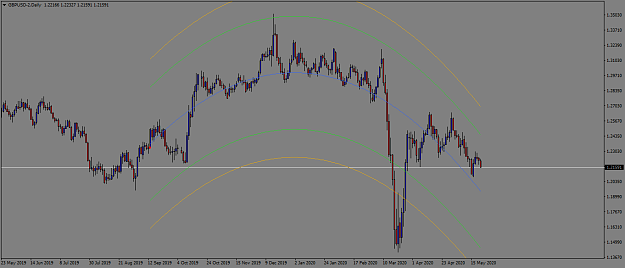
Needed to be sure of Brexit? I don't. Here's to what GBPUSD is doing Monthly - Daily = Bearish.
Center of Gravity Daily Trend Trade
- thegrimreape replied May 24, 2020
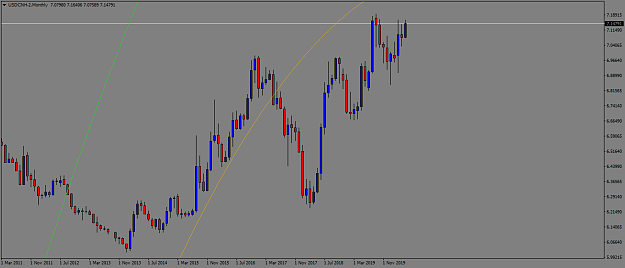
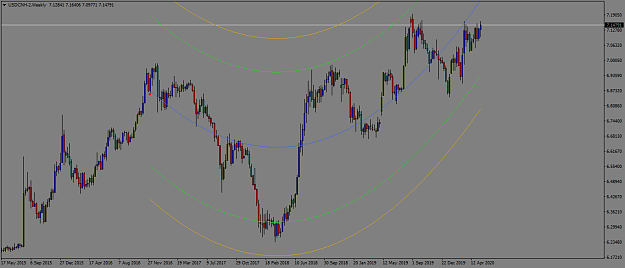
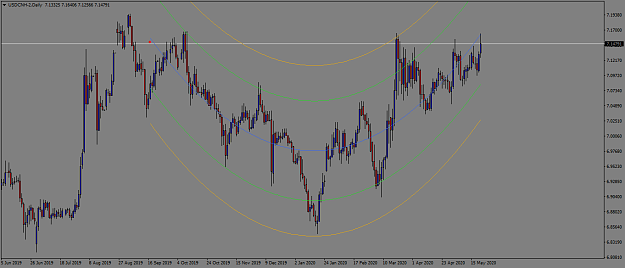
You have absolute zero idea on what China is doing? Worried if they are downplaying their currency again? Frustrated of President Trump's tweets? Look at USD/CNH's Monthly - Daily Analysis. It's bullish.
Center of Gravity Daily Trend Trade
- thegrimreape replied May 24, 2020
S/D in the past, in the now: it tested the standard deviation channel and stopped right after price tested the S/D as well. Coincidence? I am afraid not
Center of Gravity Daily Trend Trade
- thegrimreape replied May 24, 2020
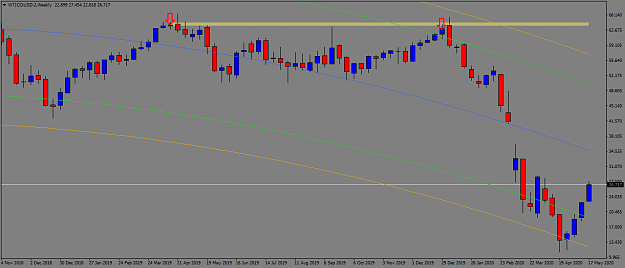
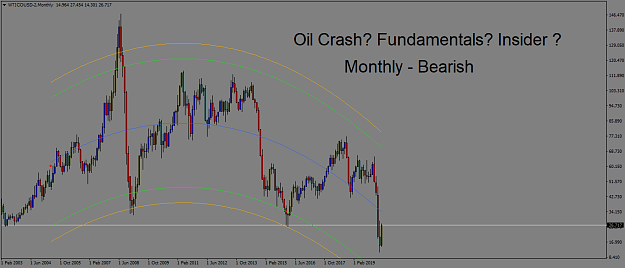
I had a great time trading the oil market before someone told me that it could crash all the way down to the negatives. Fundamental? Yes, I did my research and read the report on a daily basis. But was it fully based on the principles of ...
Center of Gravity Daily Trend Trade
- thegrimreape replied May 24, 2020
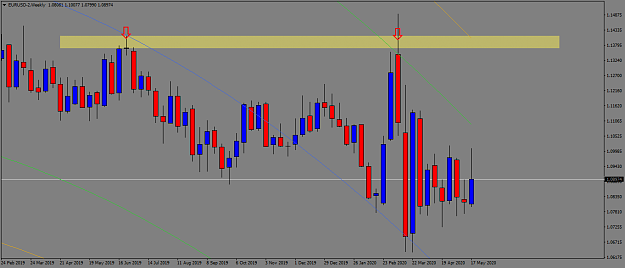
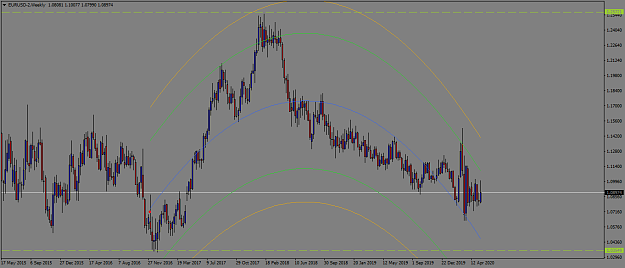
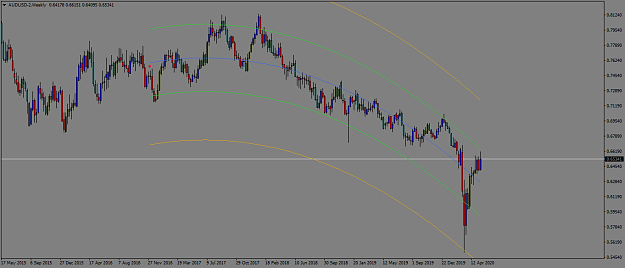
Am I cherry picking the set-ups? Nope. It's the truth. Look at the EURUSD's weekly timeframe. Past SnD intersects with current standard deviation. Where did it move thereafter?
Center of Gravity Daily Trend Trade
- thegrimreape replied May 24, 2020
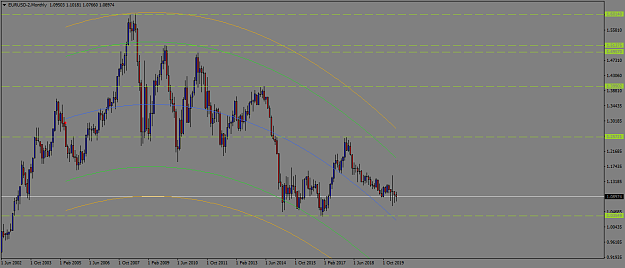
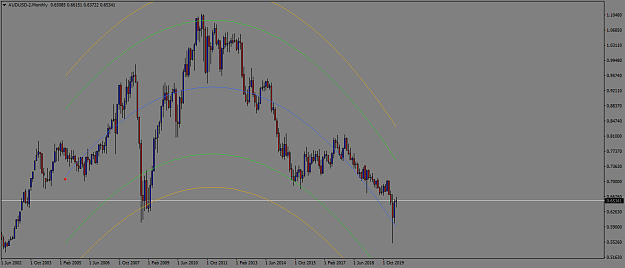
Again, from the long-term perspective. This time around let's have a look at the EURUSD chart, starting from the Monthly - Daily. Bearish...
Center of Gravity Daily Trend Trade
- thegrimreape replied May 24, 2020
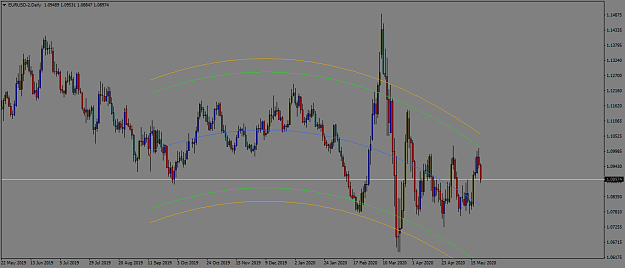
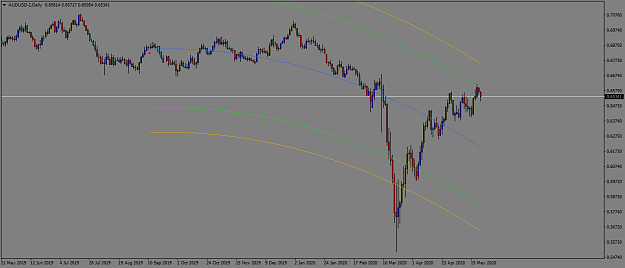
As per what has been illustrated prior, have a look at the daily timeframe. Price hits the standard deviation again... what happened to the left? A prior SnD zone. A projected downward movement following Monthly's trend? A resumption of downtrend? ...
Center of Gravity Daily Trend Trade
- thegrimreape replied May 24, 2020
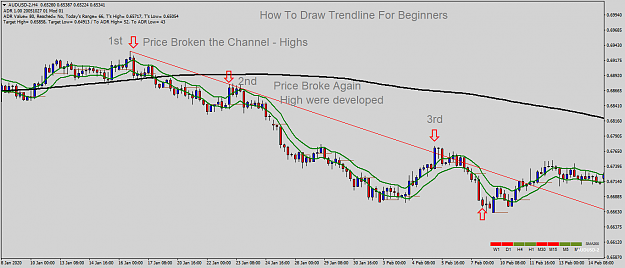
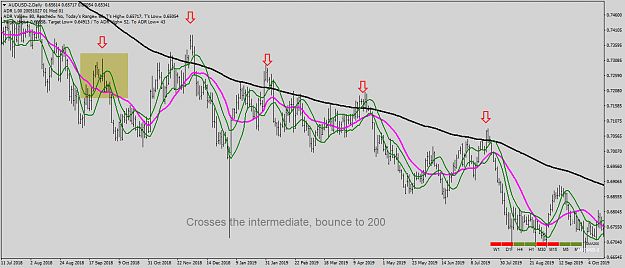
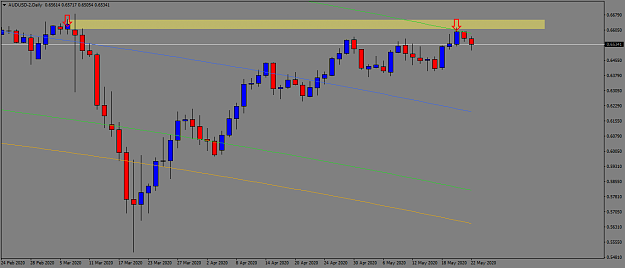
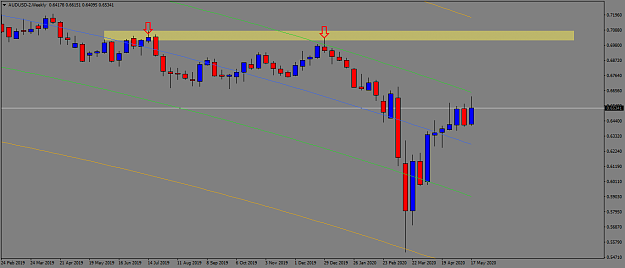
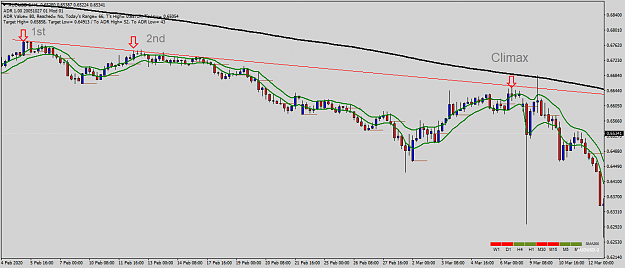
If you are a fan of trading the Supply and Demand's principle, have a look at the first arrow. Happened after a fresh engulfed, what happens after would definitely put you into a state of joyful trance. Why? Look at the second arrow. Where did it ...
Center of Gravity Daily Trend Trade
- thegrimreape replied May 24, 2020
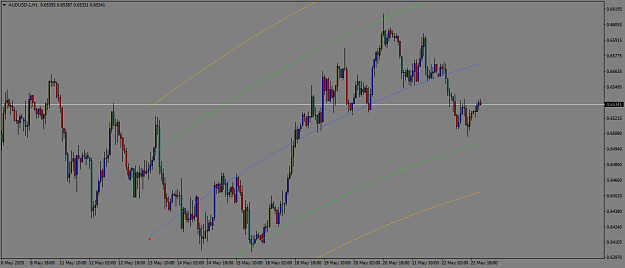
However, can we really walk past the conventional wisdom of looking at the fundamentals before charting comes after? Sure, why not. This is why I love using the Regression Channel/Linear Channel/Center of Gravity or whatever you called it. Look at ...
Center of Gravity Daily Trend Trade
- thegrimreape replied May 24, 2020
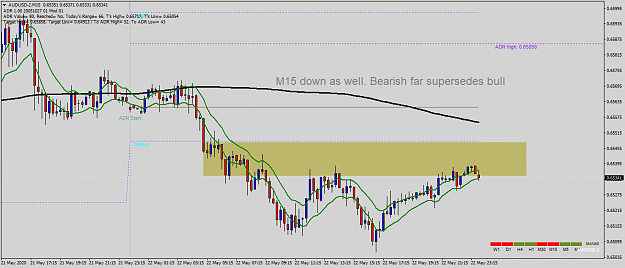
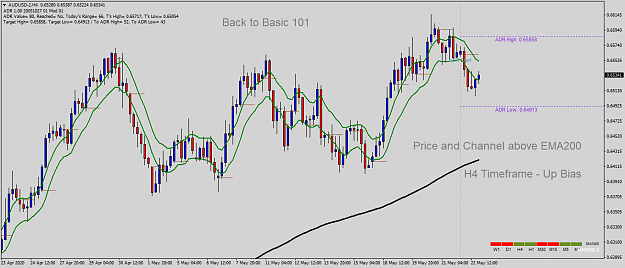
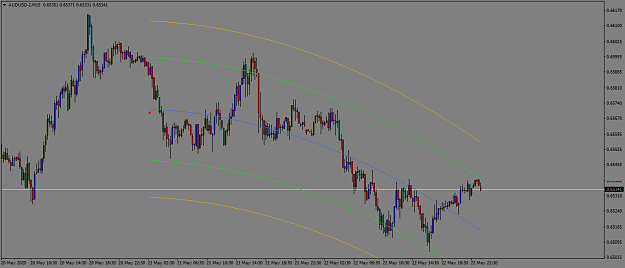
On the 15 minute timeframe, things look rather ugly. Remember, the art of multi-timeframe analysis lies in the perfect synchronization also known as harmonization between all timeframe. For instance, in AUD/USD prior chart, the H4 timeframe printed ...
Center of Gravity Daily Trend Trade
- thegrimreape replied May 24, 2020
Forgotten about the chart, here's the chart to go along with the analysis
Center of Gravity Daily Trend Trade
- thegrimreape replied May 24, 2020
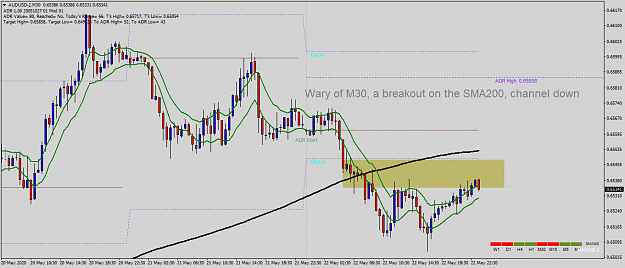
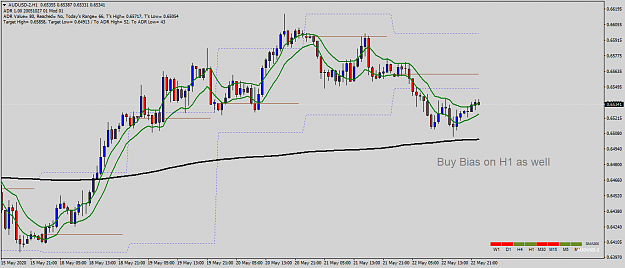
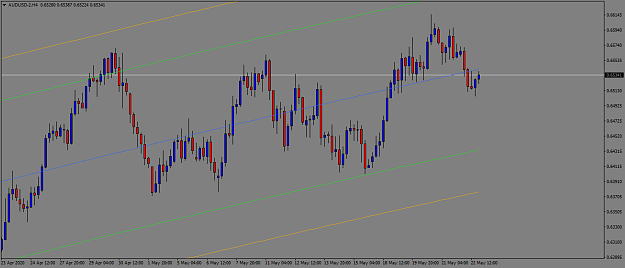
Same indicator, and same settings were applied. To avoid any confusion, I followed eTrader's settings, which is the 180 in bar back. H4 is in an uptrend on the AUDUSD chart, time to long AUD when the market reopens.
Center of Gravity Daily Trend Trade
- thegrimreape replied May 23, 2020
Another trendline format following the trend
Roadmap - A Way To Read Markets
- thegrimreape replied May 23, 2020
I saw something that can be applied in a quick fashion and that was from the observation centered on the illustration of your screenshot at initial glance. Here's my take on it in an experimental SOP
Roadmap - A Way To Read Markets