- Search Crypto Craft
- 2 Results
- stepwise replied May 17, 2007
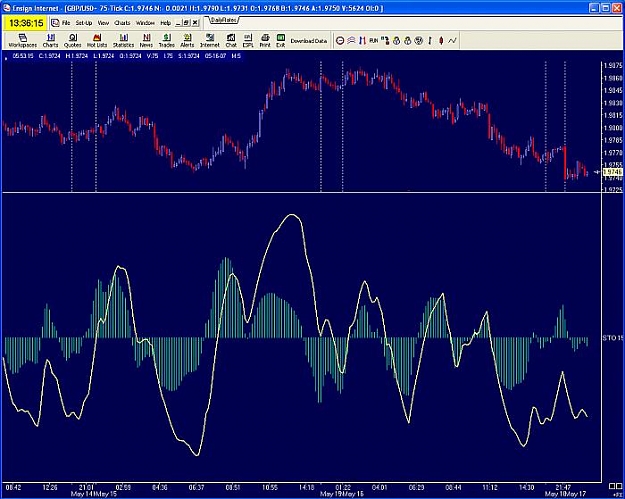
Hey there, Attached is the image. Showing is the %K (Yellow Line) and the Spread (Histogram) between the %K and the %D Lines. I am NOT showing the %D line. The %K line has a scale of 0 to 100. The Histogram (Spread) has a scale of -50 to 50. The ...
Multiple Scaling
Attached Image (click to enlarge)
- stepwise replied Mar 6, 2007
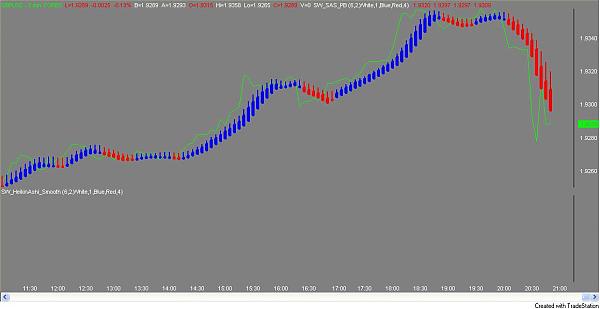
I assume that everyone here is on Metatrader? I could do it for TS - but still don't have it quite exact I don't think. Here is a screen shot - comments welcome.
HAS Indicator - Misc indicators & EA's
Attached Image
- Posts by Member Search: 'stepwise'