- Search Crypto Craft
- 110 Results
- sreeprakash replied Apr 28, 2010
I am an eurjpy fan. I love its movements. Very beautiful and dangerous pair.. Now the Direction is not clear.. I will wait for any touch/cross on any of the RSI lines..
EUR/JPY Anytime!
- sreeprakash replied Apr 28, 2010
I sold at 124.71 and closed manually at 123.45, was aiming for 123.20 but got good pips.. so closing was a good option.. I have given a green tick mark on RSI where it was reversed from 124.91
EUR/JPY Anytime!
- sreeprakash replied Jan 11, 2010
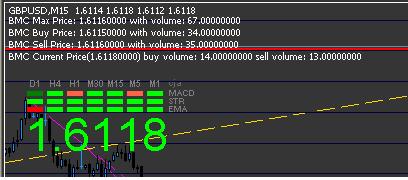
gbpusd, sold at 6172, sl 6206, tp looking for 6000.. Reason, the value 6172 playing with good sell volume and RSI going to break on 15 minute, also reversed on 4 hour chart... Will update later...
The RSI Trade
- sreeprakash replied Jan 4, 2010
Update: Price up to 6170 then dropped to 6154 and max sell changed to 6164. Then in the current price level, large buy volume entered and price pushed to 6164. Now sitting on 6170..
The RSI Trade
- sreeprakash replied Jan 4, 2010
Volume + RSI GBPUSD The Max sell was 6211 for sometime and it changed to 6157 now.. RSI reversed for a long trade and crossed 50.. I entered on 6159 and SL on 6140 because 6140 is the last 15 minute candle low. tp 6210 for now, because the max buy ...
The RSI Trade
- sreeprakash replied Jan 1, 2010
yourspace, the trend reversed there... RSI above 70 considered as overbought normally, but price can go up more... Also stoch overbought there...Possible reversal sign... You have to check pivot levels there.. also drawing trendlines are the key... ...
The RSI Trade

- sreeprakash replied Dec 31, 2009
If break 6140, then there is a possibility that it can go to 5982 areas...
The RSI Trade
- sreeprakash replied Dec 31, 2009
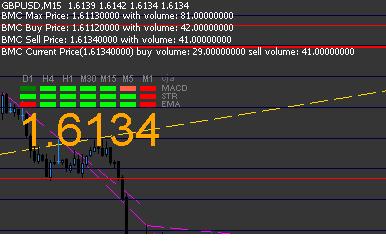
Seems sell volume absorbing buy volumes.. RSI 15 minute and 4 hour showing possible reversal.. I have given short on 6193, sl 6240, tp open.. probably 6134, then 5982...
The RSI Trade
- sreeprakash replied Dec 31, 2009
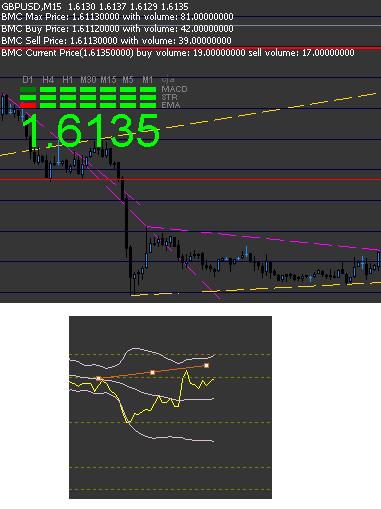
Price again upto 6151 and RSI showing little reverse.. Also max sell volume accumulated on 6134 have no change... So I given a sell on 6151.. sl 6180.. above 2/8 MM line...No TP... Lets see whats going to happen... Update: SL hit beautifully... -29 ...
The RSI Trade
- sreeprakash replied Dec 31, 2009
Price hit 6144 again and max sell moved to 6134.. It was 30 pips profit from 6115-6144.. Now dont know what price going to do.. my experience is very little on this volume thing...
The RSI Trade
- sreeprakash replied Dec 31, 2009
Price jumped from 6113 to 6137, then down to 6125 area, then now up again... Now on 6136.. I am trying to understand the volume analysis with RSI.. If both can combine, there will be no other things powerful like this...
The RSI Trade
- sreeprakash replied Dec 31, 2009
Update: The max buy and max sell moved to current price levels, i.e, 6115 and 6116. As a result, gbpusd should go up.. RSI on 15 minute also reversed... The low was 6108..
The RSI Trade
- sreeprakash replied Dec 31, 2009
This is about the volume thing.. Few minutes ago gbpusd hit 6144, MM line 1/8 on 15 minute chart... Then down to 6115 and staying around there now... RSI reversed also.. I was watching the price from 6073 to 6144.. the Volume still the same, not ...
The RSI Trade
- sreeprakash replied Dec 30, 2009
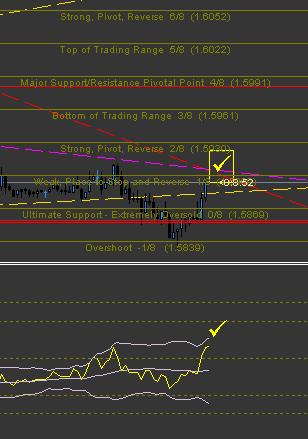
gbpusd sold... Entry 5896, sl 6020, possible target 5856.. Edit: seems going good.. Entry criteria, see pic.. MM line 1/8 1.5900 Intersection of two trendlines just above... RSI showing reverse sign, but bolinger widen...
The RSI Trade
- sreeprakash replied Dec 30, 2009
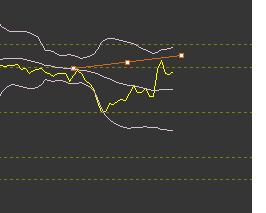
TP hit for 40 pips.. Little relief, earlier loss covered... Attached image, RSI going to touch bolinger middle line... may cross or reverse...
The RSI Trade
- sreeprakash replied Dec 30, 2009
Bought again on 5841, running good now... moved sl to entry... possible target 5881... Price reversed on RSI trendline...
The RSI Trade
- sreeprakash replied Dec 30, 2009
GBPUSD, price made another low at 5855. Weekly pivot is around 5859.. I have updated the stop loss of the above trade to 5845 and still running... See chart, RSI touch bolinger middle line and reversed.. hopefully it will touch trendline again and ...
The RSI Trade
- sreeprakash replied Dec 30, 2009
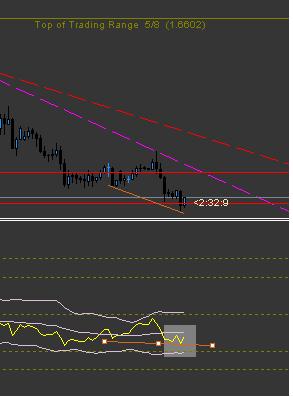
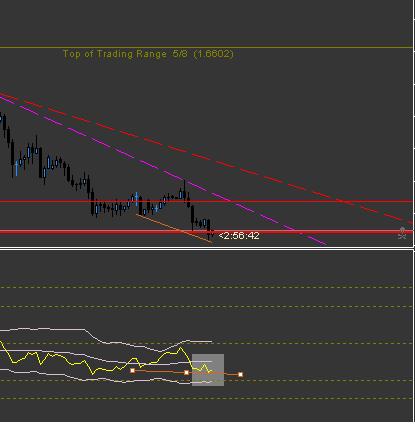
Hi Andy, thanks for taking time to analyze my setup. The trade was this; Entry 6058, SL 6075, TP manually on 6002... url +Why I did taken this trade because, I used divergence, not breakout.. Divergence + RSI 70 area + Murray Math (MM) line was ...
The RSI Trade
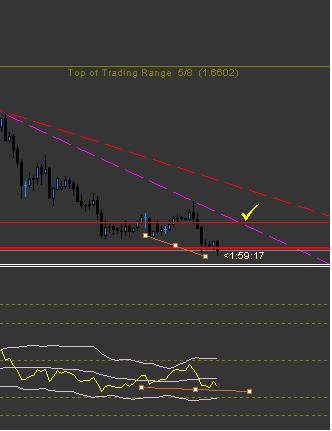
- sreeprakash replied Dec 29, 2009
Thank you marple and kareem... There is a small correction in the chart I posted above. The values shown on MM lines was incorrect, I need to change the timeframe back and forth to get correct values on lines.. its not needed for everytime, but ...
The RSI Trade