- Search Crypto Craft
- 18 Results
- skyscraper replied May 3, 2022
Walidchidmi, I see following logs , is that an error :
ZigZag 3 Windows
- skyscraper replied Apr 18, 2019
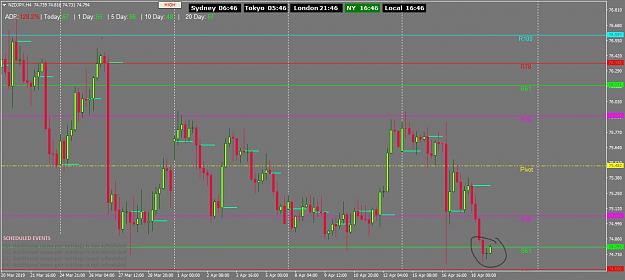
Thank you very much Davit for sharing strategy and guiding everyone in this thread. With Pivot (swing), PA and Events it really helps me to confidently place the trade. I don't trade every day due to work but do trade couple of times in a week. ...
Pivot Trading
- skyscraper replied Jun 8, 2016
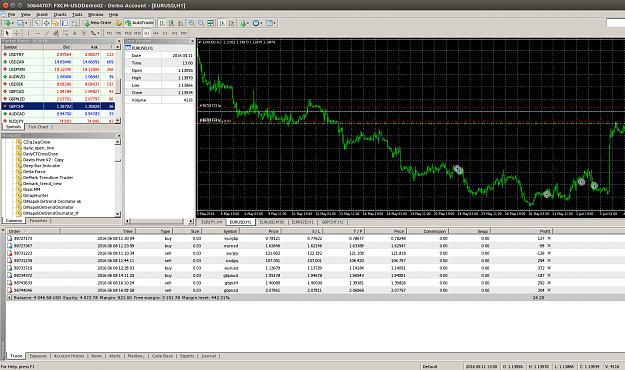
Build an EA to trade on H1 based on Moonie's system. Except I use 5 EMA for Entry as limit order and this EA only works on Cross and not on bounce. EA can be used on any TF. On TF -60 take profit based on ATR and for other TF you can set up take ...
Lower risk, stress free TDI system
- skyscraper replied Mar 10, 2016
I tried to use this EA but getting following messages but not trades open:
Free EA - High Flying Trading (HFT) EA is finally here!

- skyscraper replied Mar 7, 2012
EU Analysis and trade — Took Trade at 1.3106 , Target zone in Violet 1.3190 next 1.3222. Attached picture. Daily profile Merge from 1 to 14 days.
Auction Market Theory and Market Profile
- skyscraper replied Mar 4, 2012
EU analysis — Here is my analysis on EU range for this Month in Bracket: Top: 1.3430 Bottom: 1.3032 Breaking below 1.3180 could be good sell til 1.303X area. Attached are the charts for combine Monthly and Weekly profile.
Auction Market Theory and Market Profile
- skyscraper replied Feb 9, 2012
eu in long term context — My 2 cents -LUA1 and LUA2. It will complete the LUA1 first and then it can be range back to 1.32XX area.
Auction Market Theory and Market Profile
- skyscraper replied Jan 26, 2012
EU chart — Here is my analysis for tomorrow. H4 and daily showing sell off. Asia/london will test first the white line in the middle chart or at the most yellow box. Last one is 12 week chart. In summary I would look for area from 1.3125 to ...
Auction Market Theory and Market Profile
- skyscraper replied May 26, 2011
Chart — Looks like path of least resistance is up ( after the shakeout) 1st target MPOC 1.4223 than 1.4338 Attached is the chart. Any suggestion claudia, Jamie, alexm, evak ??
Auction Market Theory and Market Profile
- skyscraper replied Feb 17, 2011
Weekly Doji question — Malcolmb, In attached picture I highlighted the weekly doji, the one with the Red circle pull the market down, and currently we are in green circle. We are saying EU still in Bull trend, by seeing weekly chart ( green ...
vsa with Malcolm
- skyscraper replied Nov 17, 2010
EU Weekly — Formed a butterfly pattern and looks like down can go till 1.2793. Attached chart. Open short from 1.4252 and still open
vsa with Malcolm
- skyscraper replied Aug 24, 2010
VSA chart post EU — This is my first chart on EU, please suggest my understanding is correct or not?
vsa with Malcolm
- skyscraper replied Sep 21, 2009
EUR/JPY LONG Any thoughts? — EUR/JPY looks promising for Long trade all higer tf from H1 and up are long, do we need to wait for M30,M15 to be long to trade on M5?
Ichimoku forever
- skyscraper replied Apr 6, 2009
Question on Indicators — I am using indicator for Murray as given by Karthik. I used that indicator on M5 and M60. Ideally the MuRRAY SR line should be same on both the TF but it is different in M5 and M60. Attached are the charts am I doing ...
Trading using Murray Maths and Price Action
- skyscraper replied Jun 9, 2008
E/j based on Lilmoe' system — Attached is the chart for E/J. based on your system do you think it is good time to enter short.
Auslanco - GBP/JPY and GBP/USD (newstrade)
- skyscraper replied Mar 22, 2008
It is there. Compile it one more time. Attached is the chart with EA .
Trend Follower 5 Minute System
- skyscraper replied Mar 19, 2008
Chart with EA — Attached is the chart with running EA in it. Hope this helps..
Trend Follower 5 Minute System
- skyscraper replied Nov 1, 2007
Per chart this should go down:
Auslanco - GBP/JPY and GBP/USD (newstrade)
- Posts by Member Search: 'skyscraper'