- Search Crypto Craft
- 41 Results
-
 scooby-doo replied Mar 3, 2014
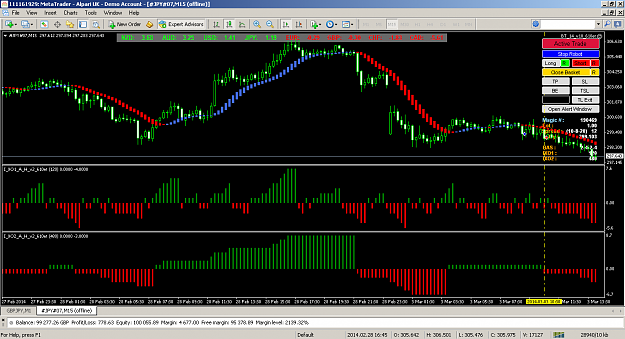
As you can see from the screen shot the IXO were both GREEN around the time but the HAS wasn't BLUE when it sent a BUY trade. Cheers
Basket Trading EA
- scooby-doo replied Mar 3, 2014
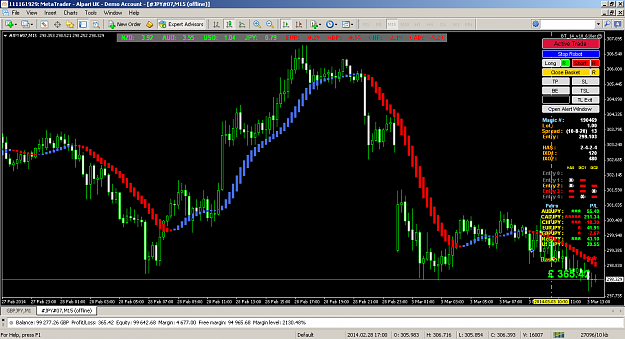
Hi, I am currently in a SELL trade which is going nicely. But does anyone know why it previously took a BUY trade as looking at the HAS it wasn't BLUE at that time. Cheers PS. I attached the SET file as a ZIP.
Basket Trading EA
- scooby-doo replied Jan 12, 2014
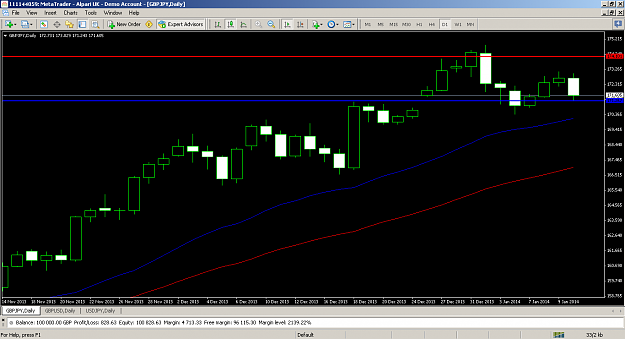
As you can see from the chart, a good buy trade has formed ready for market open.
JPY Pair Daily Chart Trader EA
- scooby-doo replied Nov 9, 2011
Hi Steve. Do you know why i would get these errors ? Scoobs
The Old Beast, How MurphyMan made this a successful trading robot
- scooby-doo replied Sep 9, 2011
This is what the interface will look like when I release it.
scooby-doo BOJ JPY pairs trading robot
- scooby-doo replied Sep 2, 2011
It's rocking...............
scooby-doo BOJ JPY pairs trading robot It now looks at every FOREX INDEX and will place basket trades accordingly but only ever one at a time. Scoobs.
- scooby-doo replied Aug 21, 2011
I didnt mean to be harsh regarding this idea but look at the gold chart. This is why the idea has made money.
Tarrini: another Basket multi-trader by SteveHopwood
- scooby-doo replied Oct 7, 2010
Wrong thread I know — Steve, Here you can see on the daily what happens when price touches 30 or 70. Generally, fcuking huge reversals. Scoobs
Sixths trading - an EA by macman, Bob and Steve
- scooby-doo replied Sep 21, 2010
NB, If you look at this chart for GBPJPY between the red lines, although the gold lines have now moved we wouldnt have taken any sell trades during the intervention because the blue 5ATR is > 200ATR. I believe allot of people took the sell XXXJPY ...
Nanningbob 4h trading system ver. 5.0
- scooby-doo replied Sep 16, 2010
Better still look at the 4H chart which NB system is designed for.
Nanningbob V5: Steve Hopwood's auto-trading robot
- scooby-doo replied Sep 16, 2010
Steve, I actually meant 5 and 200 as in the screen shot below. 1. if price below bottom gold line then the red line must be > blue line. 2. if price above top gold line then the red line must be < blue line. This would have mean that we skipped the ...
Nanningbob V5: Steve Hopwood's auto-trading robot
- scooby-doo replied Sep 16, 2010
If you look at this 4H chart of GBPJPY then you will see that the BULLS clearly still have control of the market. So, at the moment selling is not a good idea unless you dont mind some negative DD before a potential retrace. Now look at the 1D chart ...
NanningBob Study Club
- scooby-doo replied Sep 11, 2010
Steve, I recruited some new traders lastweek and they want to know if you can fly over here and show them your coding skillls ? Scoobs.
Steve Hopwood's Fib Target-level retracement auto-trader: compliments Simone

- scooby-doo replied Sep 10, 2010
Here is an example of what it actually did. As you can see it closed out the CHFJPY trades correctly. But it closed out AUDUSD trades incorrectly ALL at the same time. Scoobs
Programming Help
- scooby-doo replied Apr 14, 2010
Steve — Now its only sending 1 pair ?????????????
scooby-doo BOJ JPY pairs trading robot
- scooby-doo replied Apr 4, 2010
BOJ v2.5 24H — You will see from the picture that when the price crosses the 200 moving average that the CCI(200) crosses above/below zero. Scoobs.
scooby-doo BOJ JPY pairs trading robot
- scooby-doo replied Mar 31, 2010
Basically I built an indicator for GBPUSD, EURUSD, USDCHF and USDJPY. When it shows the dollar is OB then I buy all 4 currencies. Now, normally you would BUY GU, EU and SELL UC and UJ. But if the dollar keeps rising then you get into DD. So, to help ...
scooby-doo BOJ JPY pairs trading robot
- scooby-doo replied Feb 25, 2010
There can never be 100% fully automated hands free EA or system. Banks and other financial institutions would have built one by now given their resources. But they are very close to doing so. However, v1.9 is going ok at the momento. What I have ...
scooby-doo BOJ JPY pairs trading robot