- Search Crypto Craft
- 115 Results
-
 saka replied Jul 16, 2010
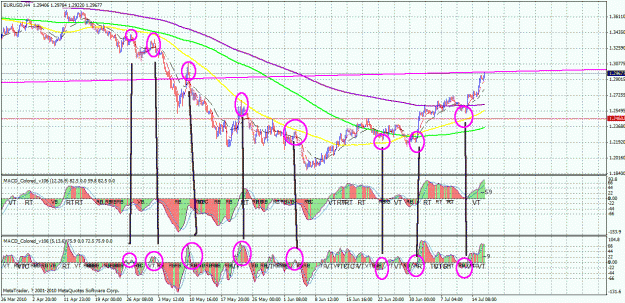
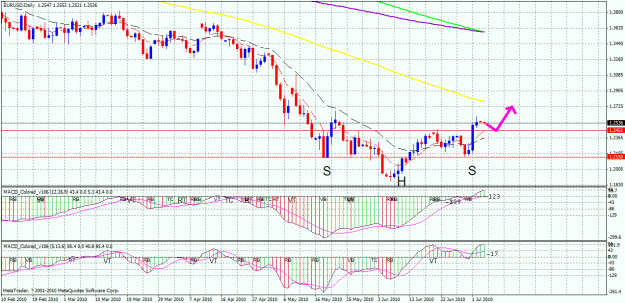
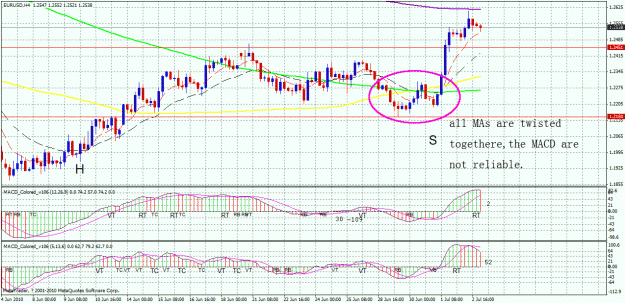
hi, lukis look at the 4h chart I show you, all the most profitable MACD signals are not TC!
4 Hour Strategy (MACD)
- saka replied Jul 16, 2010
Dear henry, After reading some of your posts, I find that you have a typical mistake that a newbie often makes when learning this strategy. This is the concern on divergency and doing CT trades! Remember, not only traditional strategy but also ...
4 Hour Strategy (MACD)
- saka replied Jul 5, 2010
Dear friend I didn't post for a while untill I saw your post, I think I need to say something. When I first learnt Phillip's 4h strategy, I think I have found a good machanic system which I only focus at certain pairs and its 4h chart. The more I ...
4 Hour Strategy (MACD)
- saka replied May 4, 2010
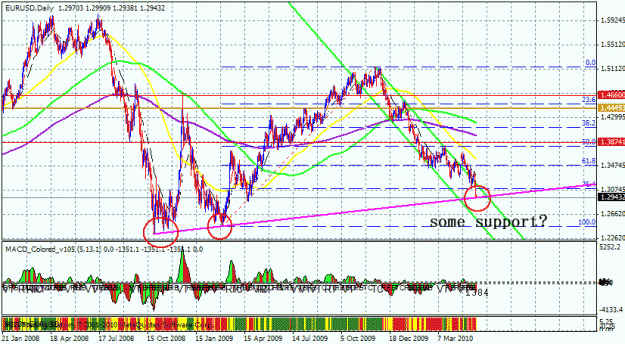
eu is approaching an important support line — hi, everyone EU is approaching an important support line which formed from subprime crisis and later, I think price would be supported at this level with a consolidation period before cracking down ...
4 Hour Strategy (MACD)
- saka replied Feb 5, 2010
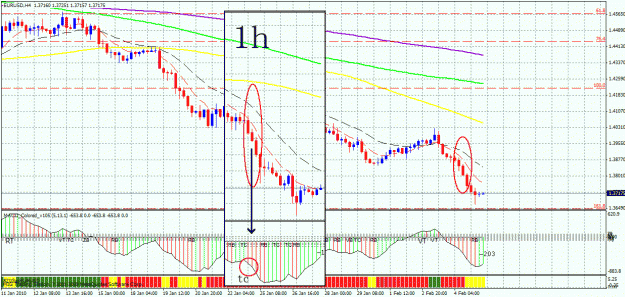
hello, everyone Is there any one who short eu last night(Beijing time)? Even though there isn't a TC signal formed at 4h chart but 1h had one? image I don't dare to enter at that time. Basically I trust 4h singals, and price had been approach ...
4 Hour Strategy (MACD)
- saka replied Feb 3, 2010
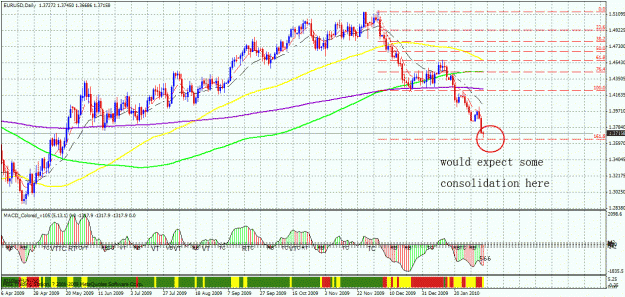
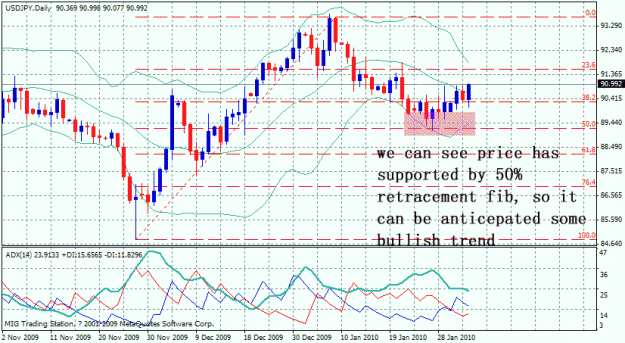
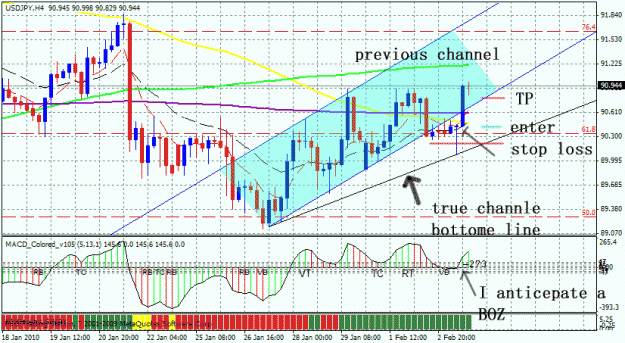
Idea about money management — hi,everyone I did a demo trade on uj based on 4h MACD strategy, but this one is something special. First let's look at daily chart. You can see clearly that price has been supported by 50% fib, we can anticipate ...
4 Hour Strategy (MACD)
- saka replied Jan 22, 2010
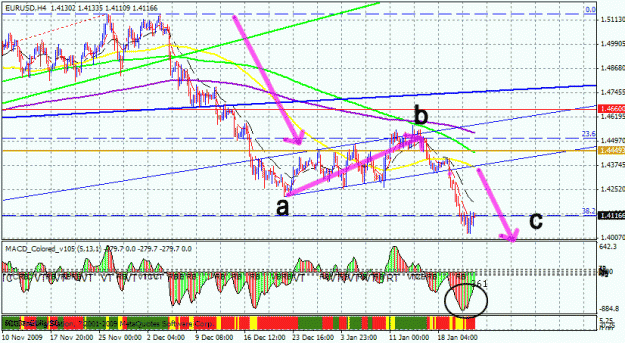
Ben, that's too aggrassive. Look at its 4h chart, it is clear to show that price has formed abc waves, and the b wave is a flag pattern. A wave is nearly 700pips drop, so the c wave should also be a same long wave. Meanwhile, after price cracked the ...
4 Hour Strategy (MACD)
- saka replied Jan 19, 2010
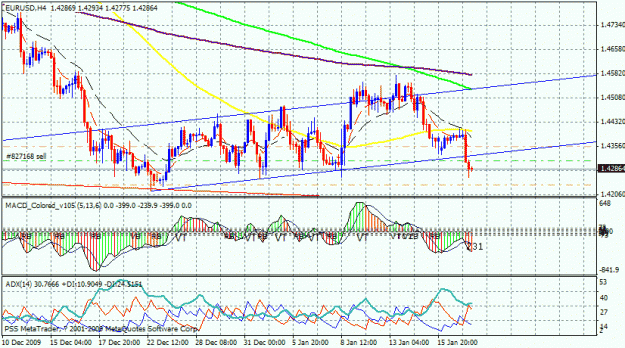
Raymond, I entered TC of eu as yours. I didn't do an early entry but follow 4h rhythm with 5% risk for it has cracked the channel and I thought this was a high probablity trade. Meanwhile, I closed half postion judged from 5min chart and reduced the ...
4 Hour Strategy (MACD)
- saka replied Jan 14, 2010
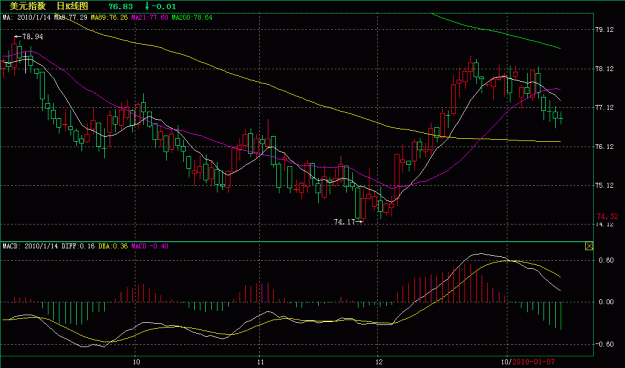
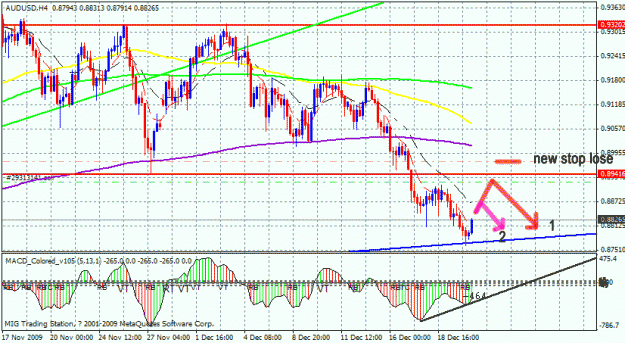
it seems that so many friend tood this AU trade. Me too, the sl was hitted which cost 1% loss of my capital. Look at USD index daily chart, it is still show some low volatililty, I think it may retrace to some fib level before another rally up.
4 Hour Strategy (MACD)
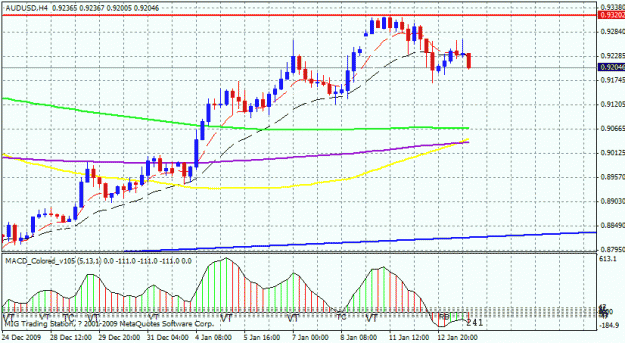
- saka replied Jan 13, 2010
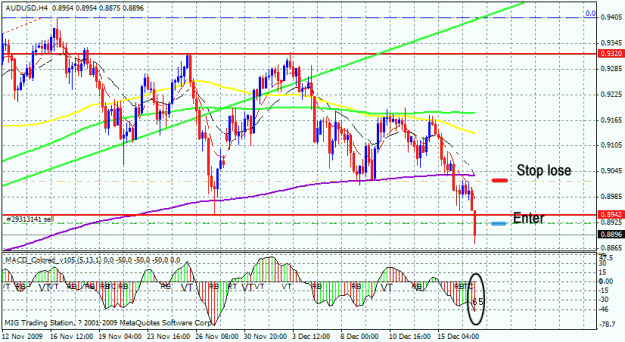
Today's AU trade — I have entered AU's 4h trade 16:00 GMT+1. Because it has resisitanted by the shoulder horizontal line formed from last sHs, even though it didn't form a TC signal at 4h chart, but I like the double tails, it has the same ...
4 Hour Strategy (MACD)
- saka replied Jan 13, 2010
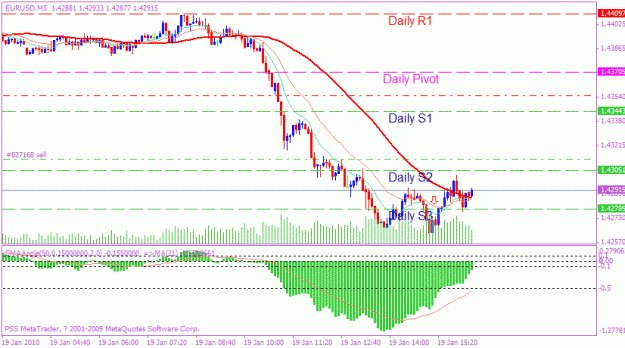
long EU with TC 8:00 GMT+1 — I have longed eu at 8:00 GMT+1 for its TC signal with 3% risk. I closed them all before 200SMA, 3% ROE
4 Hour Strategy (MACD)
- saka replied Jan 5, 2010
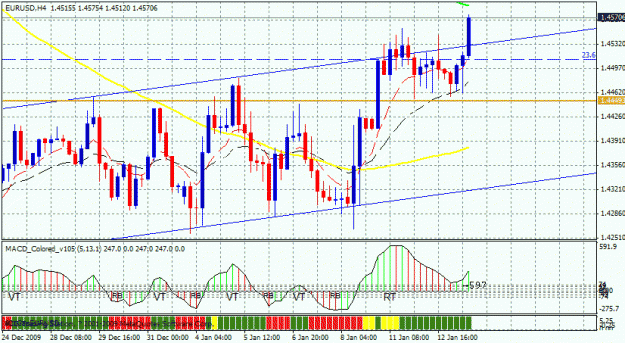
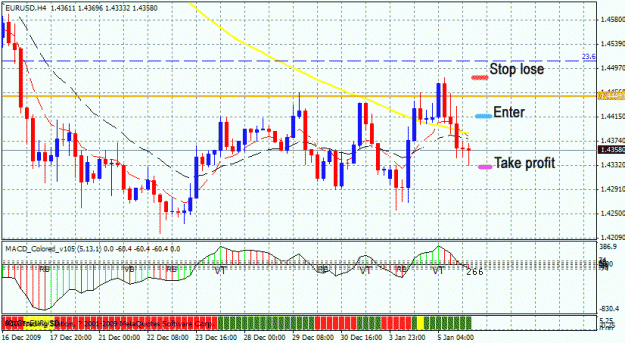
1st trade in 2010 — This is my 1st trade in 2010, eu's trade. Entered at 5th Jan 12:00 GMT+1, eu had formd a V top pattern with engulf. I looked at other pairs, and confirmed that dollar would become strong. enter: 1.4414 SL: 1.4482 Risk: 3% ...
4 Hour Strategy (MACD)
- saka replied Dec 22, 2009
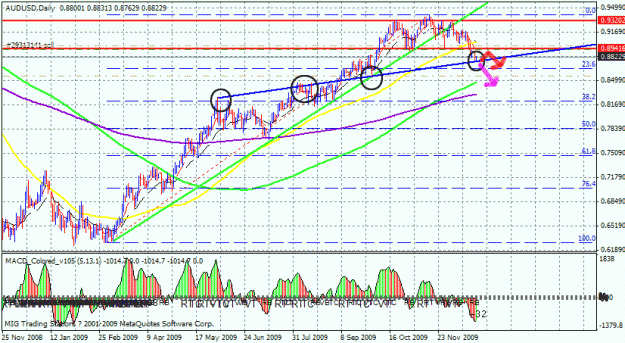
Dear Xen I still consider this is a good middle-term trade. Because it has good pattern in daily chart. I have still held all my position with a new sl. At daily chart, you can see a blue daily trend line which Phillip has showed us from weekly ...
4 Hour Strategy (MACD)
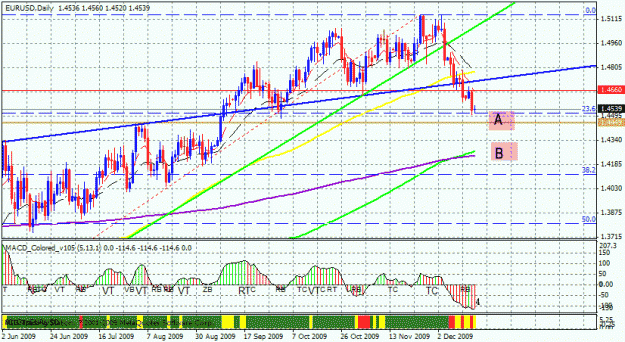
- saka replied Dec 18, 2009
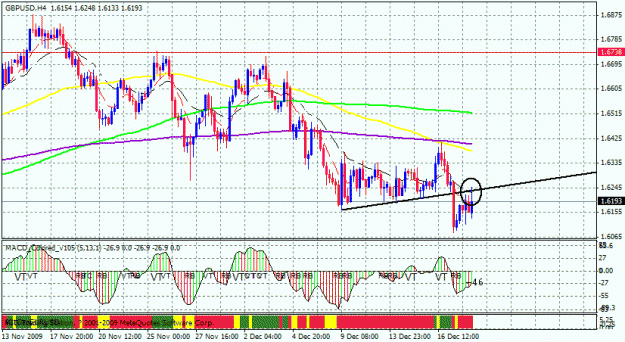
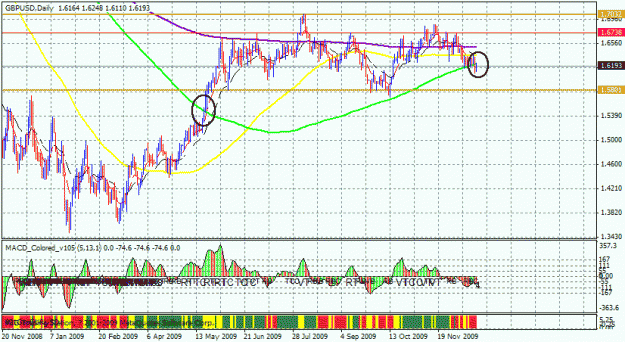
Thank Godness that I didn't open computer so early this afternoon. If I have seen the TC signal of it, I would have entered it. What ironic is it is resistanted by that trend line... image At daily chart, it is about to crack 200sma from May of ...
4 Hour Strategy (MACD)
- saka replied Dec 18, 2009
yes it is, my friend! of course it is worth to try this one, but you know, TP is always the most important thing to be set. When to close our position? This is hard to say.
4 Hour Strategy (MACD) But what I am sure is if we consider it too much, the result ...
- saka replied Dec 17, 2009
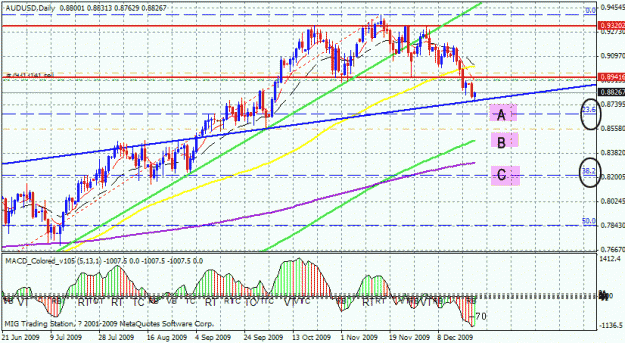
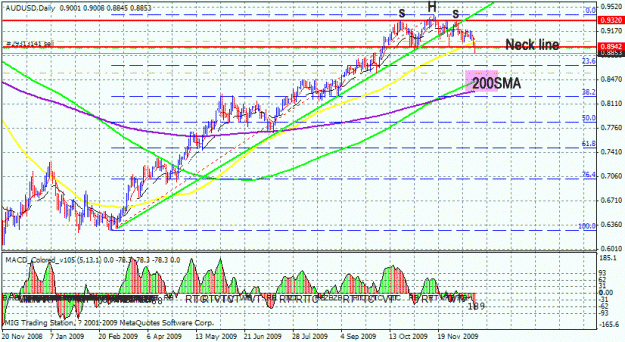
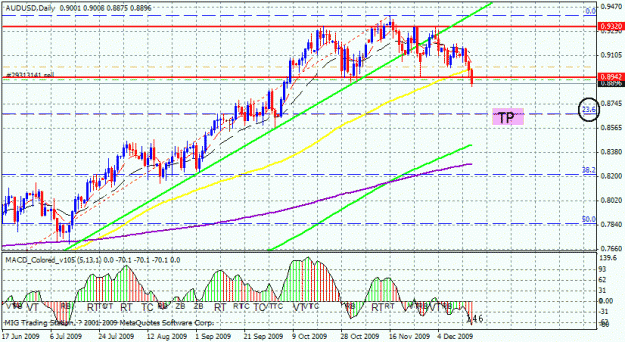
Raymond, this is a daily anaylsis, the neck line has been cracked to confirm the sHs pattern. The sHs pattern is almost 450 pips high, and that's where the price would go to, I think it will be near to 200sma of daily chart. Under a certain MM, I ...
4 Hour Strategy (MACD)
- saka replied Dec 17, 2009
today's au trade — I am a little late when the trend began, but it was still worth to enter. I have posted an anaylsis of daily chart of au. At this morning Beijing time, eu cracked deeply for more SLs had been touched. But other pairs haven't ...
4 Hour Strategy (MACD)
- saka replied Dec 16, 2009
dear Xen You're very smart of this. We both find that all the world's economic indicators are worse than expected except US' which is quite better. Smart FX traders would smell something from this.
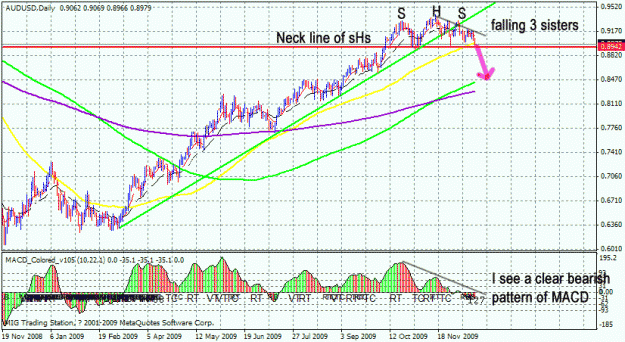
4 Hour Strategy (MACD) I darw a dialy chart anaylsis of AU, it is very ...
- saka replied Dec 16, 2009
Hi, Palmer It is a typical break of a long bullish trend line. Usually at this case, price would be much more intensive falling down than it's 45 degrees flat bullish trend before, because the sl settings are touched one by one to make down trend ...
4 Hour Strategy (MACD)
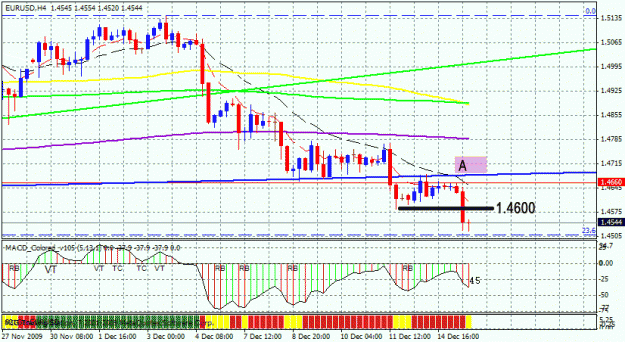
- saka replied Dec 15, 2009
I didn't enter today's TC of eu — I did stay beside computer, but I didn't enter eu's TC trade 8:00, These are the reasons. When 8:00 GMT+1 began, it was 1.4636 of eu, and the TC signal appeared. Even though there were three stars to retraced ...
4 Hour Strategy (MACD)