- Search Crypto Craft
- 71 Results
- prof8t replied Mar 23, 2021
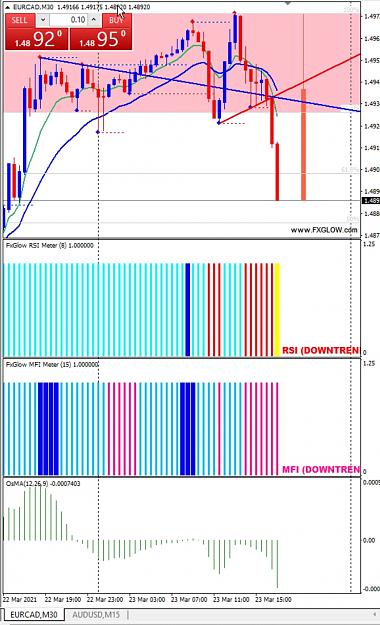
Already out of it with 15 pips but it's still going.
Trendline Scalping System
- prof8t replied Dec 9, 2020
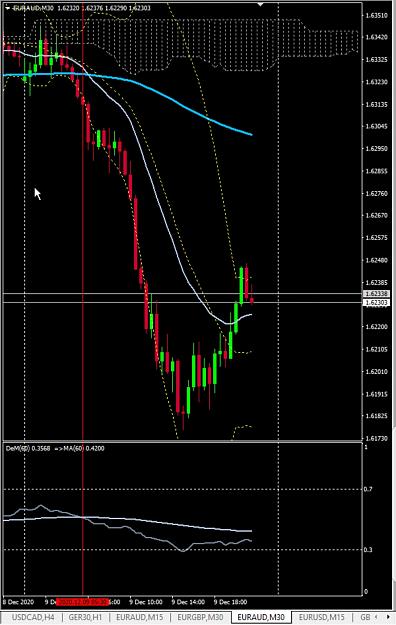
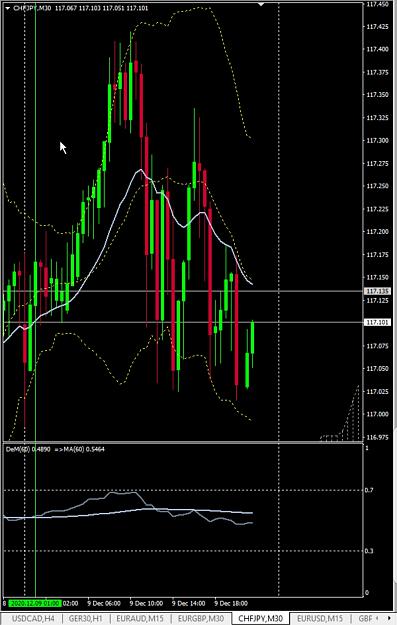
Not sure why interest in this strategy died in a matter of eleven days. Has it proven to be invalid? If you trade it by the rules and pay attention to overall trend, it seems to do just fine. But maybe I'm wrong? One buy and one sell from today.
Quarantine | DeMaker strategy
- prof8t replied Nov 16, 2020
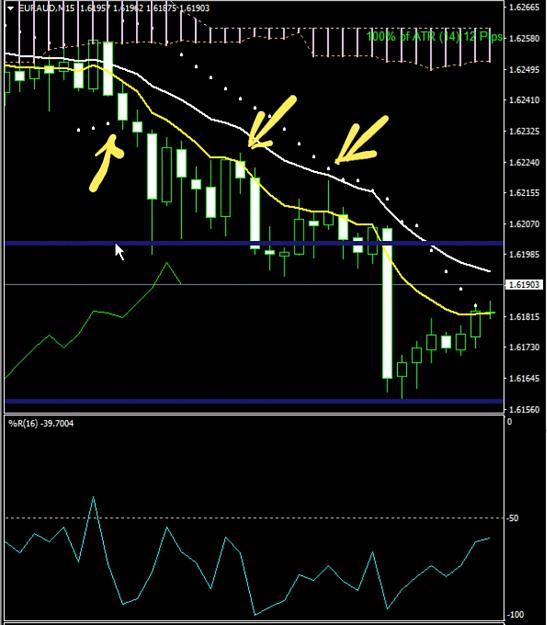
Easy 30 pips each.... 1 in London session and two in U.S. session.
Williams%R, SAR X-over 15 minute candles
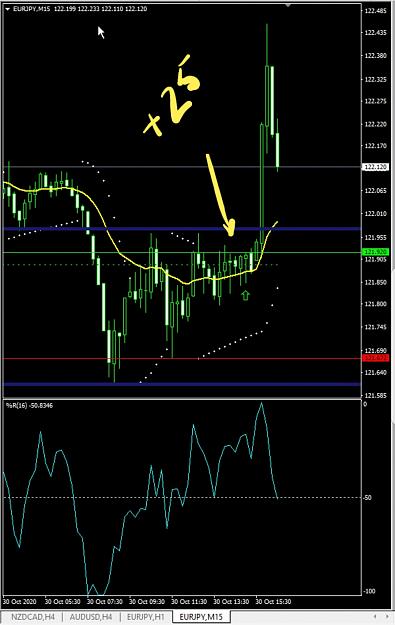
- prof8t replied Oct 30, 2020
Super dope! Easy 25 pips this morning.
Williams%R, SAR X-over 15 minute candles
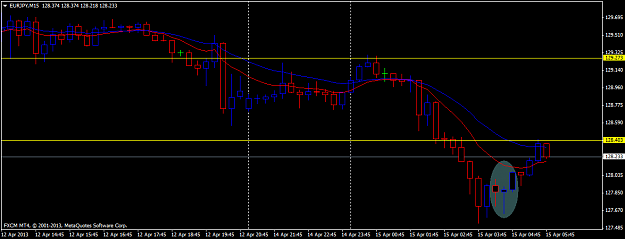
- prof8t replied Apr 15, 2013
Circled area looks like a qualifying 2 bar engulfing that just closed at s/r (yellow line) for profit.... accurate analysis?
H4 Power
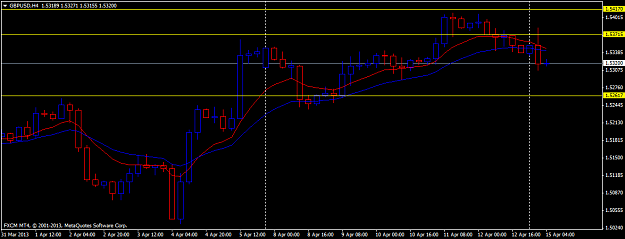
- prof8t replied Apr 15, 2013
Is this a potential short setup? Yellow lines are weekly s/r...
H4 Power
- prof8t replied Nov 1, 2012
USD/TRY — I'm currently in this one but makes me nervous for some reason. Maybe because of NFP tomorrow. Will probably close this one prematurely at some point tonight... Anyways... took it because of the triangle break and bounce off my ...
Price Action and Trading Discussion
- prof8t replied Nov 1, 2012
AUD/USD — Close outside the triangle and above the pivot (green arrow). Ten pip s/l with 80% closed at 10 pips and 20% closed at 20 pips.
Price Action and Trading Discussion
- prof8t replied Nov 1, 2012
USD/JPY Trendline — Using 80/20 money management in which 80% taken at 1:1 and 20% at 1:2... Trendline initiated after three touches. First arrow: 14 pip s/l but waited until price closed above pivot since it was less than ten pips away ...
Price Action and Trading Discussion
- prof8t replied Jul 10, 2012
Why is the fib box not updating to the current position? Happens every day.
Daily Break Strategy
- prof8t replied Mar 30, 2012
AUD/USD — Nice Friday... Two positions here... one closed for 10 pips and the other for 16 pips at the 38.2 fib line... Total of 26 pips...
The MotherFibber
- prof8t replied Oct 28, 2011
What's wrong here? — Can somone tell me whats wrong with this picture? I took three trades (yellow vertical lines) before I called it a day. Whats wrong with this picture?
Price Action Trading with Indicators! The Freebie System
- prof8t replied Oct 28, 2011
Indicies can be very profitable especially the Dow. European news that occurred long before the Dow opened yesterday set up a nice rune when it finally did. Made 150 pips on this one (entry at yellow vertical line).
Price Action Trading with Indicators! The Freebie System
- prof8t replied Sep 20, 2011
EUR/USD 15 Minute Chart — Nice quick and easy 20 pips. SL was only 13 pips. Second position moved to BE.
Price Action Trading with Indicators! The Freebie System
- prof8t replied Aug 19, 2011
Thursday Dow Chart — Ok... I have to admit that I cheated today... I entered the market short at a position just off the chart with the intention of riding the slow downtrend into the US session. But watching the other world markets and their ...
Price Action Trading with Indicators! The Freebie System
- prof8t replied Aug 18, 2011
EURUSD (1 Hour) — A little late to the party on this one, but not too late to trade it. Taking a small risk on this one. All looks good, however, I decided set a pending order to buy 3 pips above the pivot.
Price Action Trading with Indicators! The Freebie System
- prof8t replied Aug 17, 2011
Wednesday's Dow Chart (15 Minute) — Today's Dow chart didn't fail to please... Trade 1- (Long) Textbook by the strategy... Two positions of +20 and +40 pips. Trade 2 - (Short) Counter by the HA indy but liked the position of the stochastic. ...
Price Action Trading with Indicators! The Freebie System
- prof8t replied Aug 17, 2011
Dow Chart (15 Minute) — This was my trading on yesterday's Dow chart. As you can see, the behavior of the Dow during the US Session (Gray box) is extremely volatile, however, pips can still be made in a few different ways. I marked my four ...
Price Action Trading with Indicators! The Freebie System
- prof8t replied Aug 17, 2011
That's interesting.... my chart shows the candles a little differently. That trade would have resulted in about a 27 pip profit on my chart (entry at candle close of blue line).
Price Action Trading with Indicators! The Freebie System
- prof8t replied Aug 16, 2011
OK Here's a chart just for you...
Price Action with Indicators! ~The Freebie Newbie BOLOSO System~