- Search Crypto Craft
- 16 Results
-
 plymgary replied Jun 5, 2019
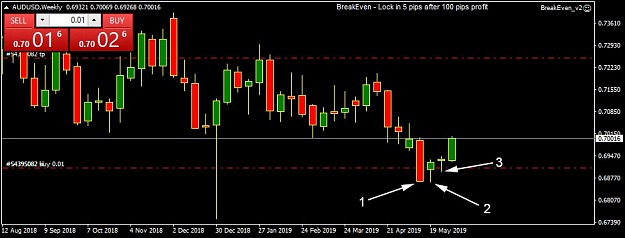
Nope, I just eyeball it. It's difficult for me to explain in words so, I'll post a chart to explain one of my entries. From this chart: image 1. Position 1 shows the candle has closed under the 52 week low. In fact, it's the lowest the price has ...
Weekly Charts - So Much Better (for me!)
- plymgary replied Jan 3, 2019
Have you ever thought about: Buy Price is above the 100EMA on all three time-frames. Buy on price touching the 100EMA low. 1:3 minimum R/R. B/E @ 50% of S/L. Sell Price is below the 100EMA on all three time-frames. Sell on price touching the 100EMA ...
Easy pullback strategy
- plymgary replied Dec 27, 2018
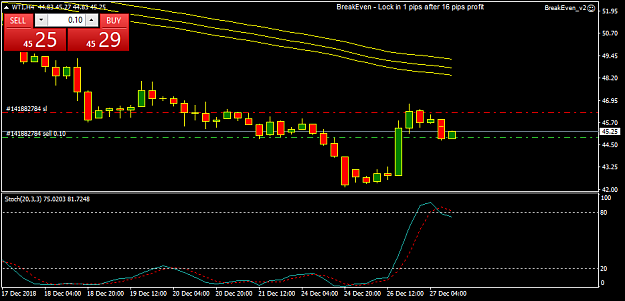
Placed a sell on WTI. Price also breached a minor support level so I'll see how this one plays out. The lack of volume in the markets is a slight concern though.
Easy pullback strategy
- plymgary replied Dec 20, 2018
Really promising so far. Hopefully it'll remain profitable for the next 3 months. I'm sticking with the original instructions of following the trend.
Easy pullback strategy
- plymgary replied Dec 18, 2018
Hi. This looks interesting, thanks for sharing. Trying this strategy on demo (4 hr charts) with a few of my own rules: 1. I'm still following the rules of ensuring price is below/under the EMA on the three time-frames. But: 2. I'm waiting for the ...
Easy pullback strategy
- plymgary replied Aug 29, 2018
I'm surprised this thread isn't more popular? Saw a really nice setup yesterday. On the daily chart the price hit the top of a descending channel for the third time, passed through a support, and also crossed an ascending trend line. I took a short ...
EUR/CHF
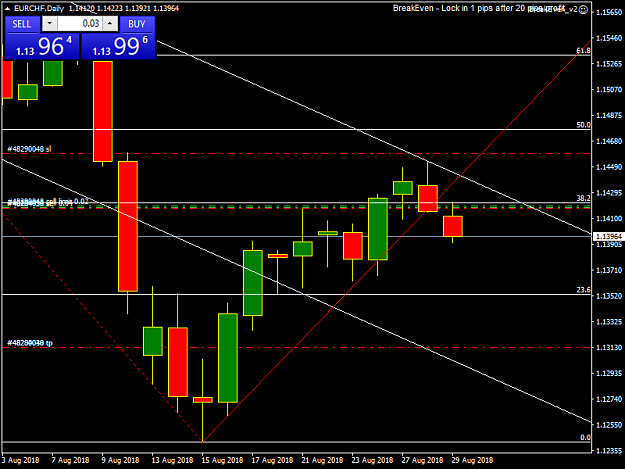
- plymgary replied Aug 21, 2018
Took a long as third touch of the channel, and the bears seemed to run out of steam yesterday. Fingers crossed!
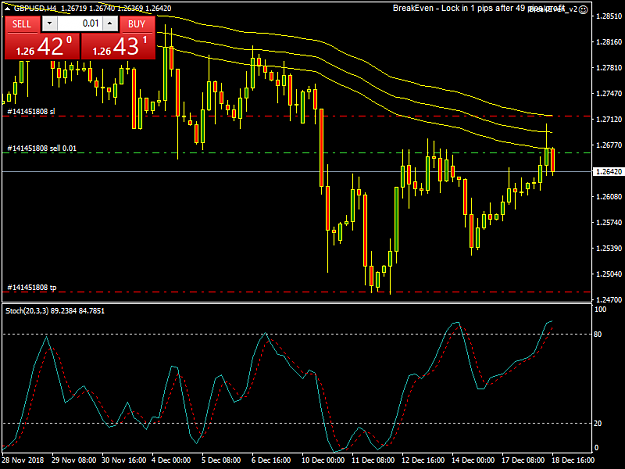
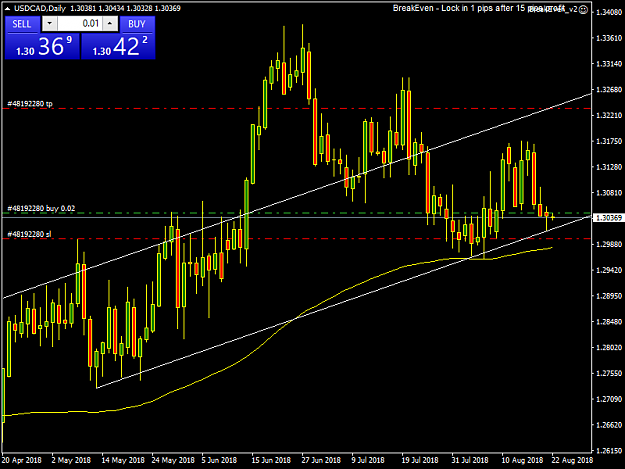
USD/CAD
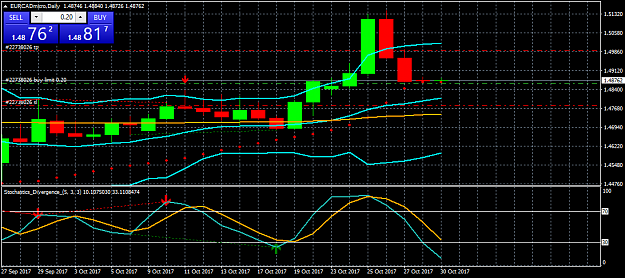
- plymgary replied Oct 29, 2017
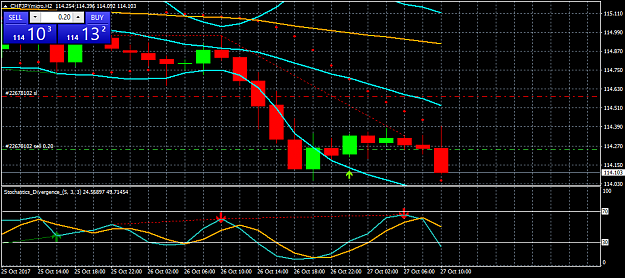
Hi again, Just looking at the EURCAD daily chart and think I've spotted a signal for a hidden bullish divergence in the stochastic? All the other indicators are in the buy territory too. Not sure if it makes much difference, but price is also above ...
Simple Low Risk Price Action Trading w/ TE Results
- plymgary replied Oct 27, 2017
Took an entry on the 2hr chart this morning (at the 8am point). I think it's okay as all the indicators were in the 'right' places. I've gone for a 1:1.5 risk/reward. Let's see what happens. ETA: Later noticed it was at the bottom Bollinger band on ...
Simple Low Risk Price Action Trading w/ TE Results
- plymgary replied May 23, 2017
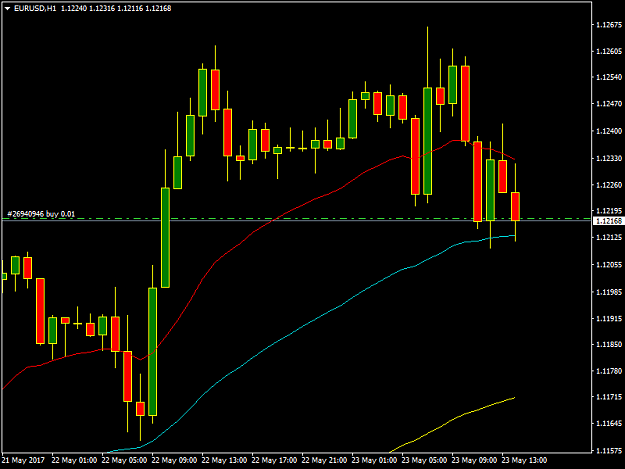
In again for EU. Met support and still in an uptrend. image
Breakout London Timeframe
- plymgary replied May 23, 2017
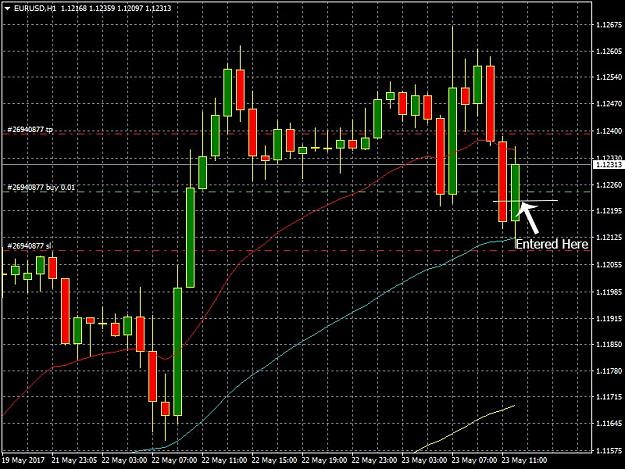
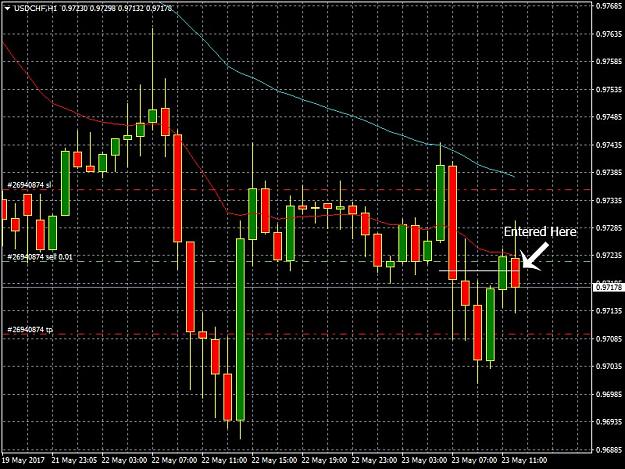
Sure, here's what I did. Let me know if there's any errors in my logic! With the EUR/USD I placed the Buy order because it was close to (what I would consider?) a support level. It was also in an uptrend. image With the USD/CHF I placed the Sell ...
Breakout London Timeframe
- plymgary replied May 13, 2017
My SAR goes missing each time I close down my MT4. I then have to reset the indicator each time I open it again. Is this normal? I do have 'Allow DLL Imports' checked. I also have the SAR underneath my 2hr chart. image
The Paradox System
- plymgary replied May 12, 2017
Hello, Just working through this again and trying to work out how the trading plans are done. The original post (#21) says: 1 hour chart ROMAR down or up Smooth down or up EMA down or up But I'm not sure what the down or ups mean? Is it in relation ...
The Paradox System
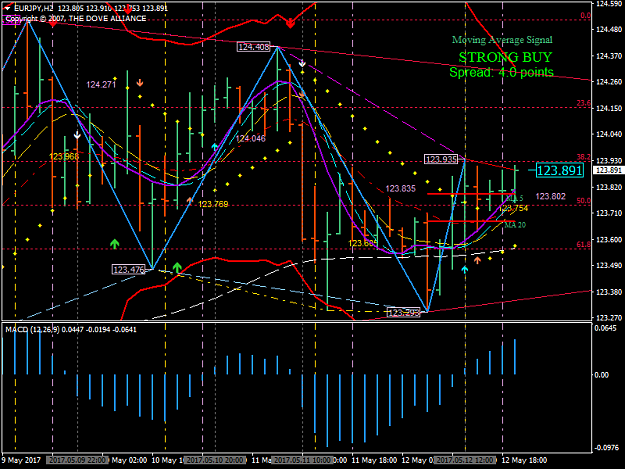
- plymgary replied May 11, 2017
Okay, what did I do wrong? Haha. Earlier today (around 11GMT) the EJ hit the lower BB on the 1hr chart. So, I took this to mean 'buy' expecting it to retrace to the ema again. However, it just kept falling! What error did I make? image I've ...
The Paradox System
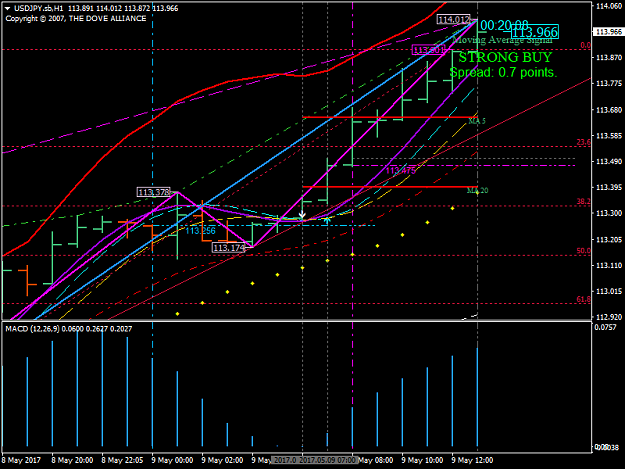
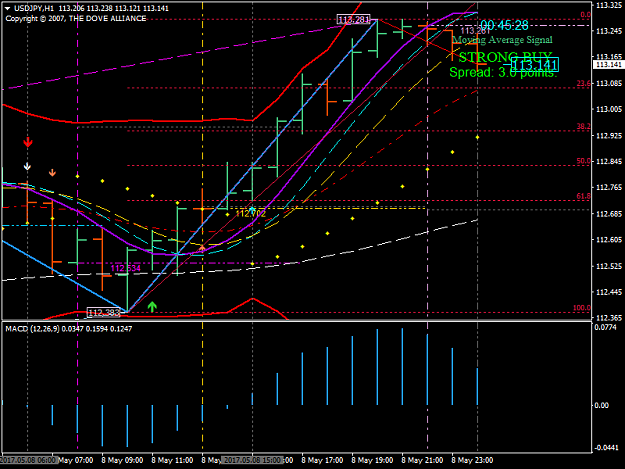
- plymgary replied May 9, 2017
Thanks for the help. I think I've got everything set up correctly now? My broker opens at 17:00 EST, and they have 6 weekly bars. Would you be able to compare my screenshots with yours to make sure it's all correct please?
The Paradox System One Hour: image Two ...
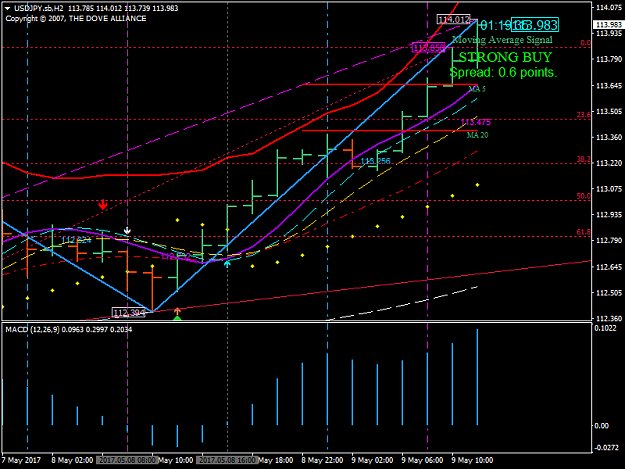
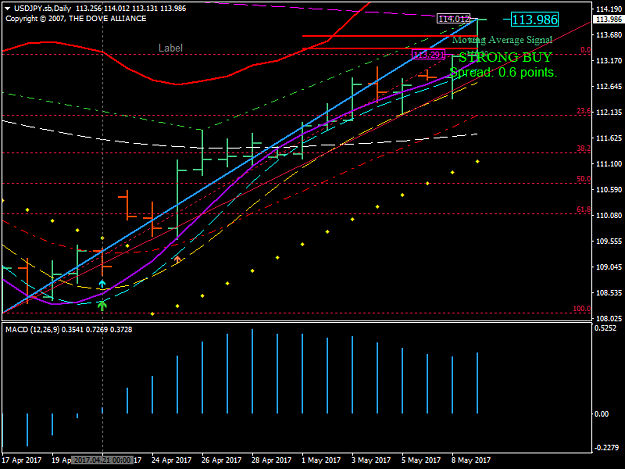
- plymgary replied May 8, 2017
Help, please!
The Paradox System This system looks really good. I just want to make sure I've got it set up correctly? Here in the UK we're currently in EST (+1 GMT). My broker works in GMT. I did try -1 in the sessions indicator offset but the Sydney Open Time was ...
- Posts by Member Search: 'plymgary'