- Search Crypto Craft
- 55 Results
-
 philmcgrew replied Oct 17, 2009
I've never heard of that but if it's anything like this, I could see getting disqualified for it...
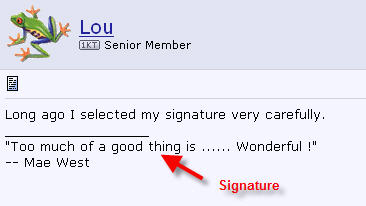
picking technique

- philmcgrew replied Oct 17, 2009
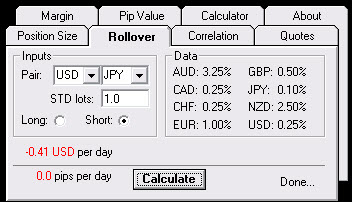
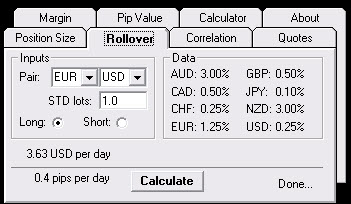
Yes, you will pay a whopping 41 cents for holding that position past 1700 ET. Hardly enough to alter your trading strategy or get your panties bunched up (whichever comes first). You can download the calculator here: url Welcome to Forex Factory.
Rollover interest charges
- philmcgrew replied Apr 15, 2009
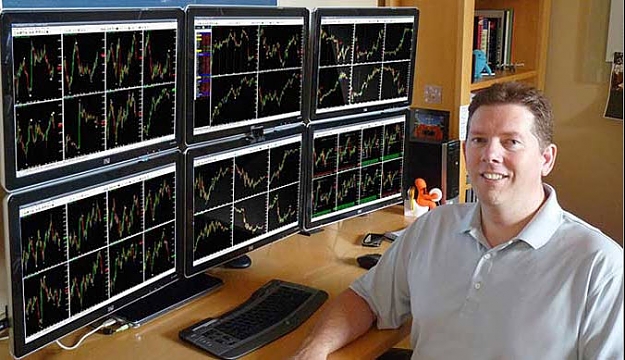
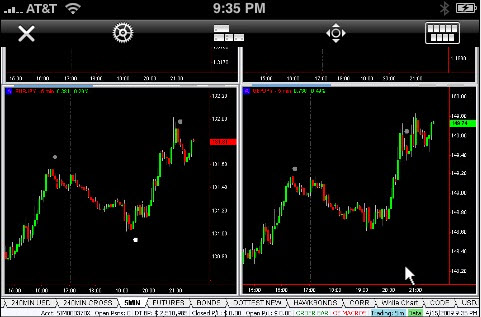
Get an iPhone and remote into your desktop. (and I can kick your a$$ in tennis between trades
Storm or Bold for mobile trading? )
)
- philmcgrew replied Apr 13, 2009
Swap rates are usually expressed in currency (dollars) or pips. Percent usually refers to the interest rate differential (IRD). You can't get $30 per contract on the EURUSD. As a matter of fact, you would be lucky to get $3. In your particular ...
question about swap rate
- philmcgrew replied Dec 28, 2007
You could trade 1 mini-lot. Leverage has no bearing on the results.
Unit Size

- philmcgrew replied Dec 27, 2007
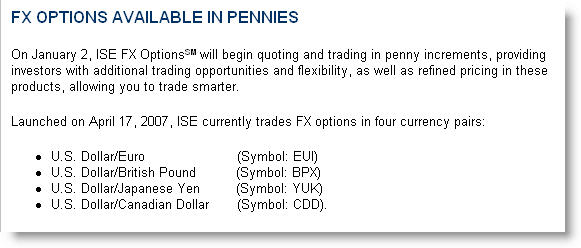
The ISE just announced penny increment quotes on their FX Options. Good stuff!
OptionsXpress has FX options!
- philmcgrew replied Dec 18, 2007
An easier way would be to just find the symbol for your charts and graph it.
how can i calculate US index ??

- philmcgrew replied Dec 16, 2007
Brokers can only see your orders if you and your pets refuse to hear the appropriate headgear. (that is not me or my cat in the picture)
Can Brokers Really See Us???


- philmcgrew replied Nov 27, 2007
I have 3 comments on this subject: 1. Fibs are equidistant. 100 - 23.6 = 76.4 and 100 - 38.2 = 61.8 and of course 100 - 50 = 50. Although there is a correct direction to draw them, they are after all supposed to measure a retracement, it wouldn't be ...
Please solve this
- philmcgrew replied Nov 24, 2007
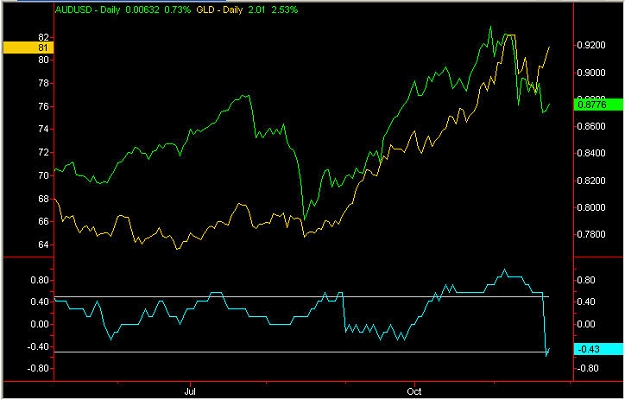
During the second half of this year there has been little to no correlation between the AUDUSD and Gold. The indicator at the bottom is the correlation calculation. Generally, anything between -0.5 and +0.5 in considered non-correlated. At the ...
EUR/AUD reversal?
- philmcgrew replied Nov 20, 2007
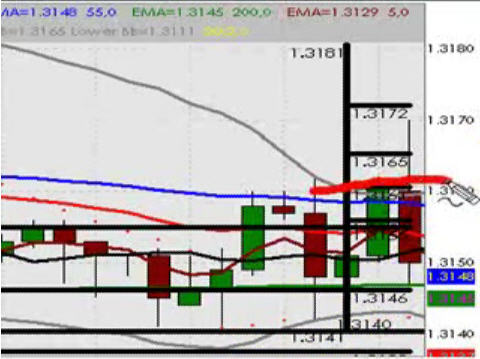
Here's the difference for the CHFJPY chart. I picked this chart because it's a little more choppy than some others and that is where the biggest differences will appear. In some cases the difference was a few hundred pips. Only you can say if that ...
Is there a difference?
- philmcgrew replied Nov 18, 2007
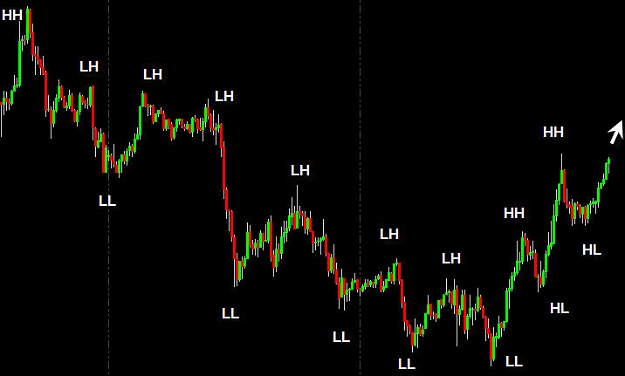
Market Up Trend - A series of distinct peaks which form higher highs (HH) and distinct valleys which form higher lows (HL). Market Down Trend - A series of distinct peaks which form lower highs (LH) and disctinct valleys which form (LL). Choppy ...
"Trend" , how do you actually trace the current trend ?
- philmcgrew replied Nov 15, 2007
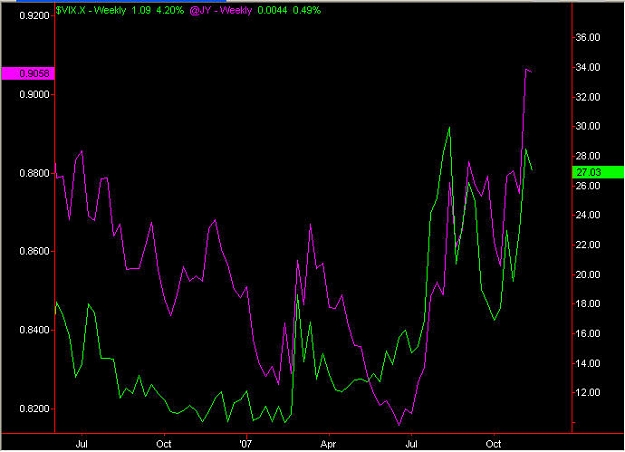
As much as I try, I can not understand how buying equities affects the carry trade. What do you mean that buying equities is also buying into the carry? Below is a chart of the VIX which is considered a good measure of fear and risk appetite and the ...
Trading The "Normal State"
- philmcgrew replied Nov 12, 2007
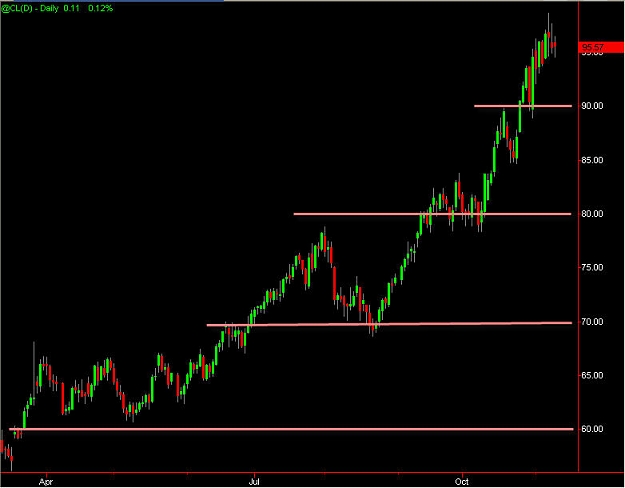
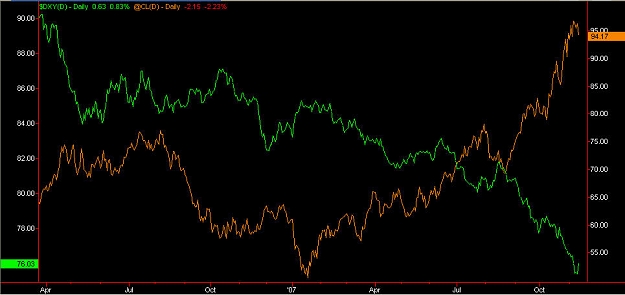
Since April of this year the USD has dropped 15% while oil rose 41%. So you can't completely blame the USD for the price of oil. Supply and demand has not changed over the near term (long term definitely) so clearly, something else makes oil move. ...
I see oil reaching 100 USD?!
- philmcgrew replied Nov 9, 2007
I'm not seeing that on the chart. Even if there was a selloff at $70 was it because it hit a meaningless round number or was there a fundamental reason?
I see oil reaching 100 USD?!