- Search Crypto Craft
- 18 Results
-
 perrier replied Jun 23, 2010
I am waiting too but the daily and weekly TF are still short term bullish especially yesterday's closing candle on the daily. My current 4H emas imply that the move north is underway so I really hope 2400 can cap it. I won't long so will be looking ...
EURUSD
- perrier replied May 17, 2010
I exited @ 2319 after it didn't charged through the LTL in that single move. Now I will wait for a retrace on for my 5M stoch or short again when it breaks down the LTL. To me, its down now until FO or LO.
EURUSD
- perrier replied May 12, 2010
Still waiting for my long signal to enter based on stoch. This is my 1H chart. it did not break my lower TL. Breaking of the LTL will change my bias.
EURUSD
- perrier replied May 12, 2010
I am bullish as well for today. Just came back from Ikea from my lunch appointment. Missed the doji below. Seemed like a temporary bottom is formed at 2630. Looked to me like a double bottom with the top at 1.3040 (61.8% from 30 Apr to 6 May). Now ...
EURUSD
- perrier replied Apr 8, 2010
Did the double bottom just completed? It is very close to the bottom of 326x and my 4H stoch is already crossed to the upside.
EURUSD
- perrier replied Mar 23, 2010
PA bounced off the bottom TL. If it closes above 3535 on this hr (completion of 4H candle), it would signal a buy opportunity.
EURUSD
- perrier replied Mar 23, 2010
My chart says there should be more room down. I am watching 3482-3477. I will be waiting for my stoch to give me the buy signal, if any.
EURUSD
- perrier replied Mar 18, 2010
Ping Pong Chart — If PA goes above the second lower TL on the next candlestick, I am buying. So far, the stoch has been pretty spot on for my intraday trading. Another reason is the hammer.
EURUSD
- perrier replied Mar 10, 2010
As driver55 has mentioned 3625. 3620 is the 50% fib from the last movement down. This number also correspond to the lower TL for the previous low. This TL is still valid for me. If it closes above 3620, then I would look for a short above 1.37, ...
EURUSD
- perrier replied Oct 16, 2009
Just want to share my simple chart and what I think may happen soon. From the 4H chart, we can see a double top peaking at the monthly R1 (1.4970). Daily R1 on my chart is 1.4988 while yesterday's was 1.4973. On the Daily chart, we can see a ...
EURUSD
- perrier replied Oct 8, 2009
Good morning all! — Nothing beats the sight of good food to start the day for my fellow Singaporeans.
EURUSD


- perrier replied Sep 2, 2009
Here is the chart that I have posted yesterday minus all the MAs. The TL below is still working well today, coupled with the MAs that I had, looks like an uptrend at this moment. I have also included another TL drawn from the top downwards. I think ...
EURUSD
- perrier replied Sep 2, 2009
I am waiting around the daily pivot for my next entry. On the 1H, the TL that I have draw is still holding at the moment.
EURUSD
- perrier replied May 14, 2009
It has been more bullish for the last 6hrs. Price can still go anywhere from here. Just monitoring the PA to see what the London market offers.
EURUSD
- perrier replied May 13, 2009
It still looks bullish to me. Although I have a -ve position but will hold onto it as it is not too far from the current PA. Anyway, you can try to buy around ~367x and TP around 3700 and repeat with tight SL. Thats more than 200 pips if I am not ...
EURUSD
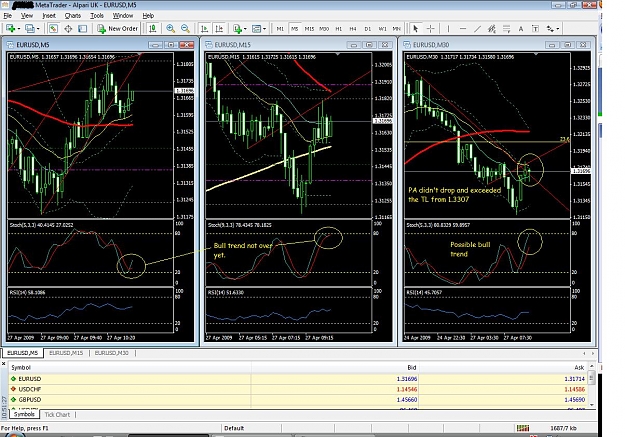
- perrier replied Apr 27, 2009
Too early. You should have wait for the candle on the 15M to conplete @10:45:00 Here's what I see on my chart. I have drawn an additional TL from the high 1.33007 and the PA crossed it so this uptrend may take a little while more or it could also be ...
EURUSD
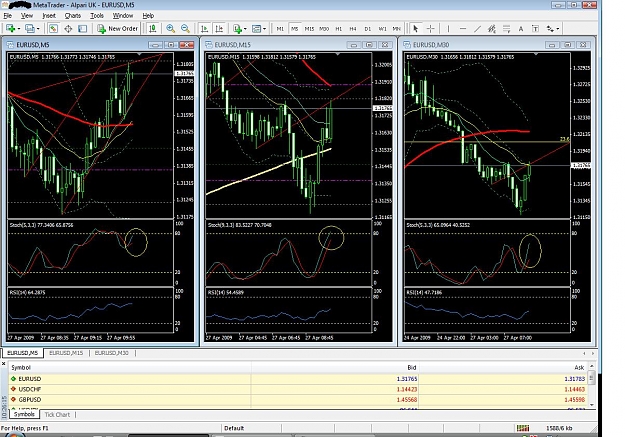
- perrier replied Apr 27, 2009
Just sit back and relax while the PA is working. Right now, until there is confirmation from the 3 TF (stoch) that the price is overbought, I will not enter.
EURUSD
- perrier replied Mar 3, 2009
Just my thought. On my 1H chart, he 50SMA is indicating some resistance @2626 (an old resistance if I can remember correctly). On my 15M chart, the 200SMA is also proving to hold resistance @2624 range. Personally, with my Stoch indicating ...
EURUSD
- Posts by Member Search: 'perrier'