- Search Crypto Craft
- 52 Results
- pdean123 replied Mar 2, 2011
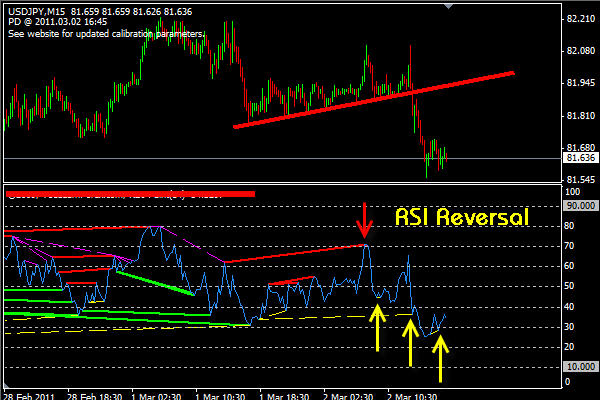
M15 signal RSI Negative Reversal — I caught that. Chart below. Reversal could have been entered at time of confirmation or after it broke the trendline. What do you think? Yellow arrows are positive divergences.
Flag trading the trend
- pdean123 replied Sep 9, 2010
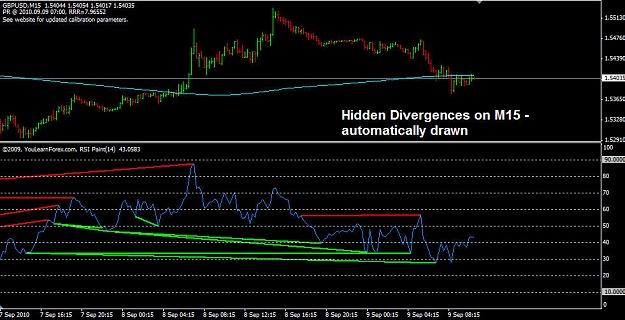
Sorry, this is M15 previous M5 — Sorry the previous chart was M5 this is M15.
Cable Update (GBPUSD)
- pdean123 replied Sep 9, 2010
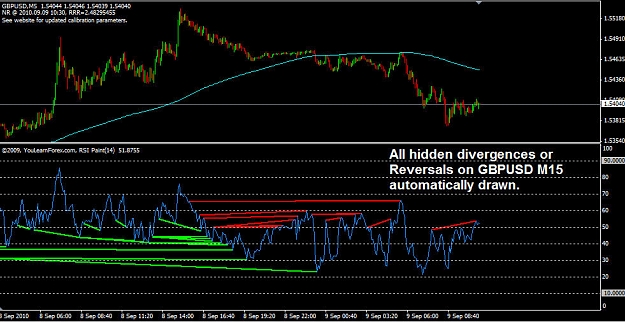
Hidden Divergences/Reversals on M15 — Chart showing all hidden divergences and reversals on RSI automatically drawn.
Cable Update (GBPUSD)
- pdean123 replied Jul 2, 2010
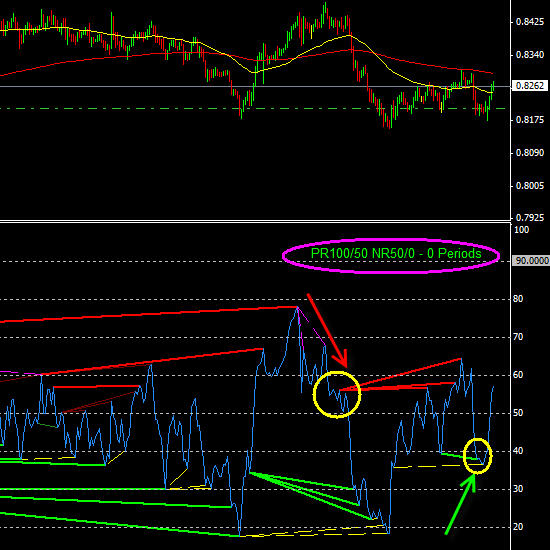
Negative Divergences — Actually there have been 5 starting on 6/30 as well as one negative reversal and one positive reversal.
EURUSD
- pdean123 replied Jun 30, 2010
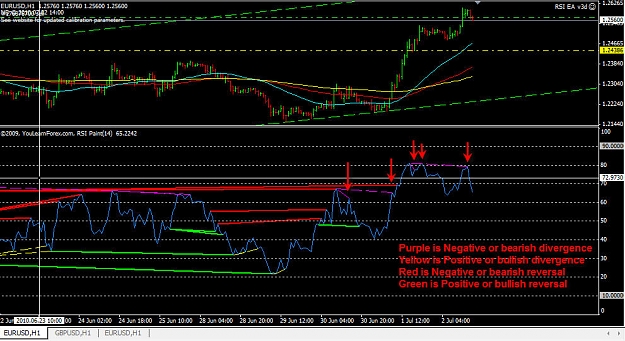
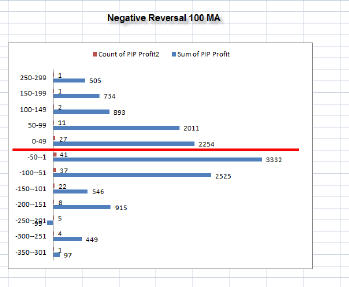
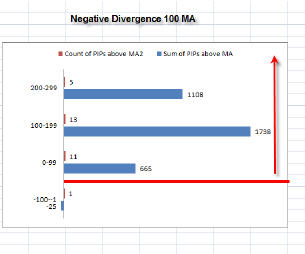
Reversals and divergences — Here is a current EURUSD chart that shows a 3 reversals on RSI which are momentum changes (red) and a divergence (purple). There are two statistical charts that show where the 100 SMA is when these are successful. ...
EMA/RSI Trend Spotter system
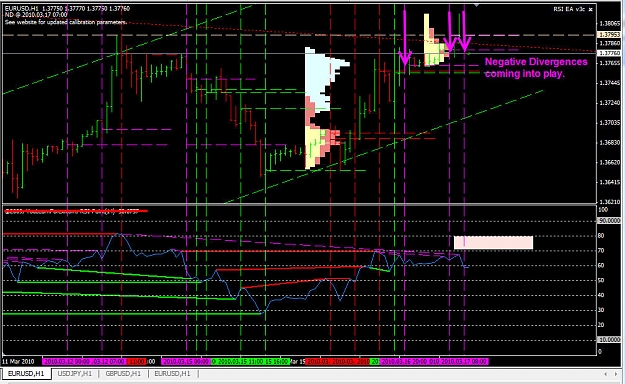
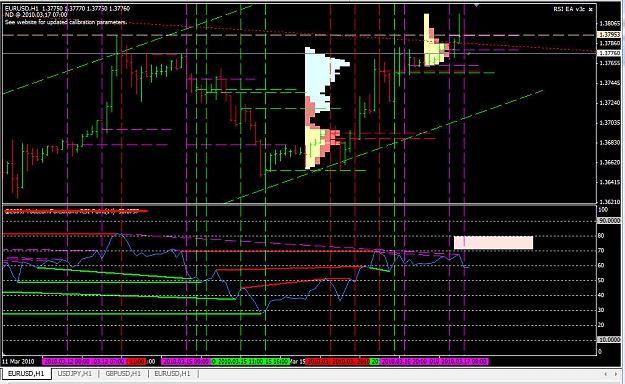
- pdean123 replied Mar 17, 2010
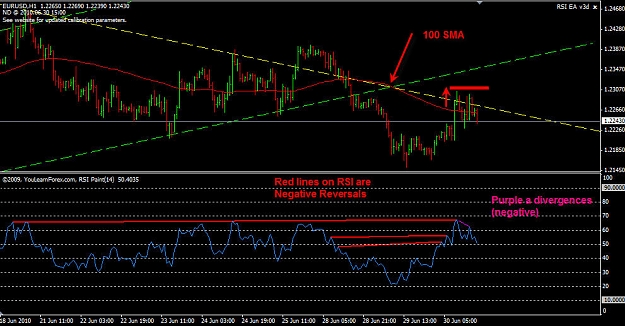
May see a momentum reversal — Sorry about all the vertical lines on the chart. I'm plotting reversals and divergences in a vertical format. The last three momentum signals have been negative divergences. I don't see tension yet away from ...
EURUSD
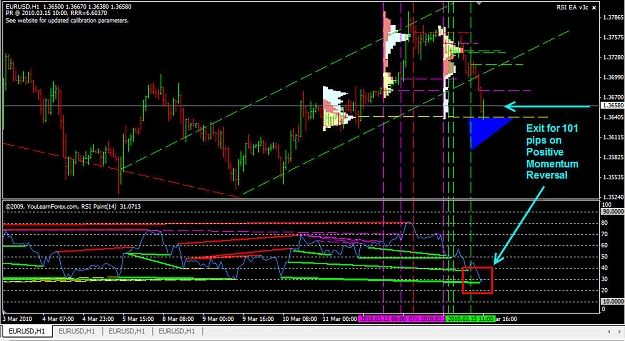
- pdean123 replied Mar 15, 2010
Trade Update - Exit 101 pips — Exiting trade from Friday entry on Positive Momentum Reversal signal. Total pips: 101
EURUSD
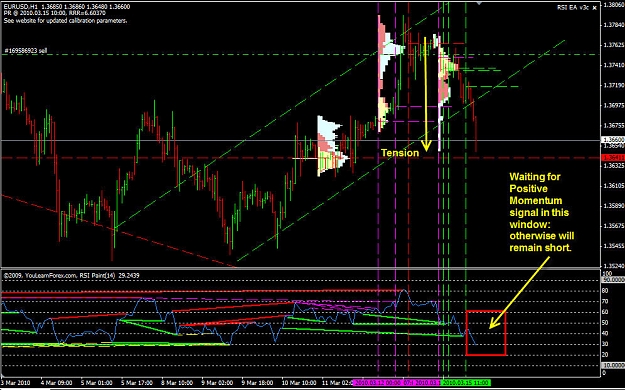
- pdean123 replied Mar 15, 2010
Trade Update — Tension in market again. Long if momentum signal, continue short if not.
EURUSD
- pdean123 replied Mar 15, 2010
Trade Update — Posted Friday. Red arrow - tension in market (Fri) Yellow arrow - trade entered (Negative Momentum Reversal) 3 checks - momentum attempts to upside all failed. Purple dashed - Negative divergence levels over last three days. Red ...
EURUSD
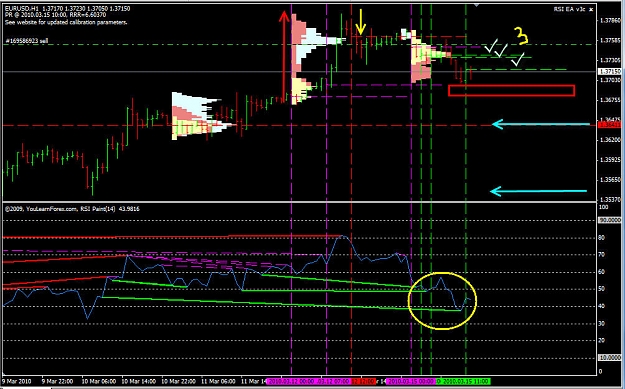
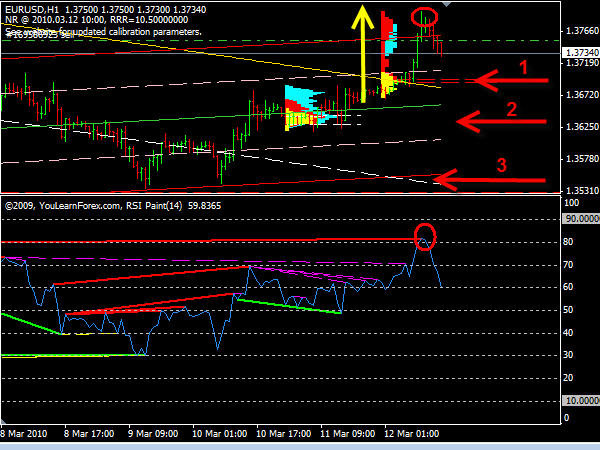
- pdean123 replied Mar 12, 2010
Previous Trade — Previously posted trade today. Yellow arrow is tension in the market away from equilibrium. I seldom place a trade without tension away from an equilibrium point. Momentum Reversal at red price circle. I only trade on Momentum ...
EURUSD
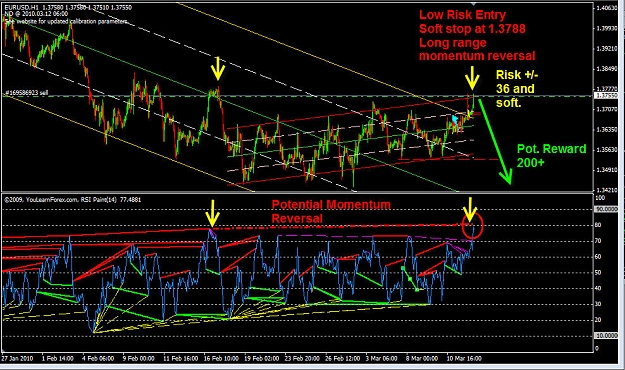
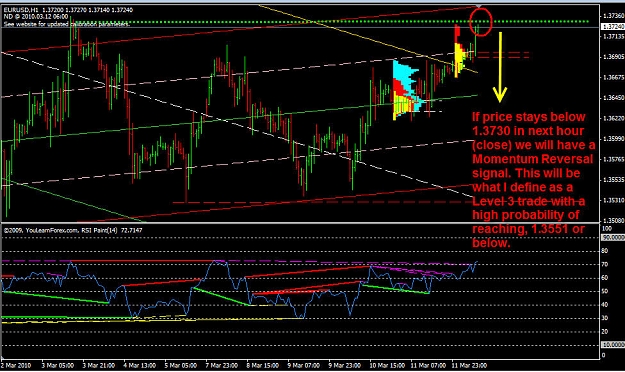
- pdean123 replied Mar 12, 2010
Trade Setup — Low Risk entry on Pre-Momentum Reversal opportunity. Market Profile stretched. Minimum reward back to equilibrium.
EURUSD
- pdean123 replied Jan 22, 2010
EU — I have been in EU short on three separate entries: 12/29, 1/4, 1/5. Entering again today. See chart.
Trend Trading All Pairs

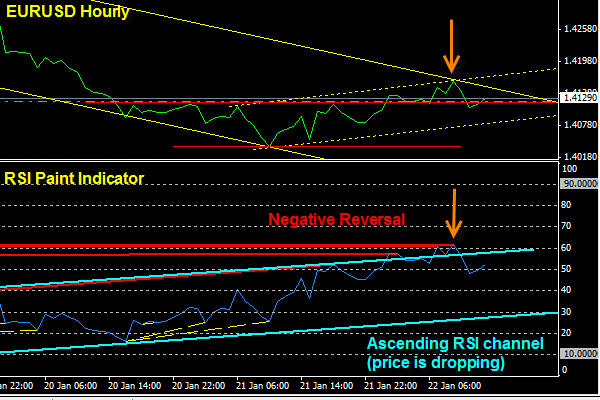
- pdean123 replied Jan 22, 2010
EU — I am short the EU from 12/29, 1/4, and 1/5. Entering again at Negative Reversal on RSI and Upper Channel on Price. RSI is in a ascending channel which actually means RSI is losing momentum to upside. See chart.
EURUSD

- pdean123 replied Dec 8, 2009
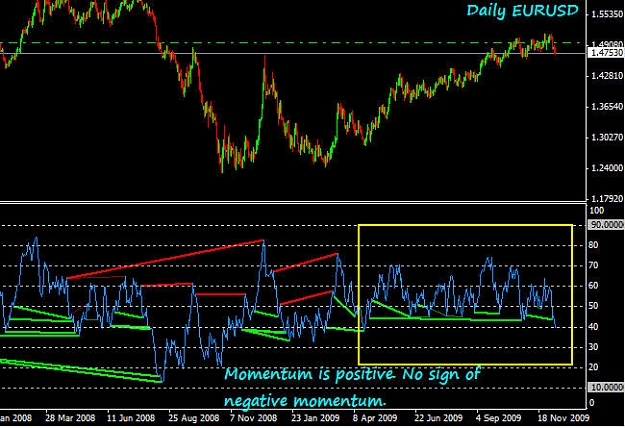
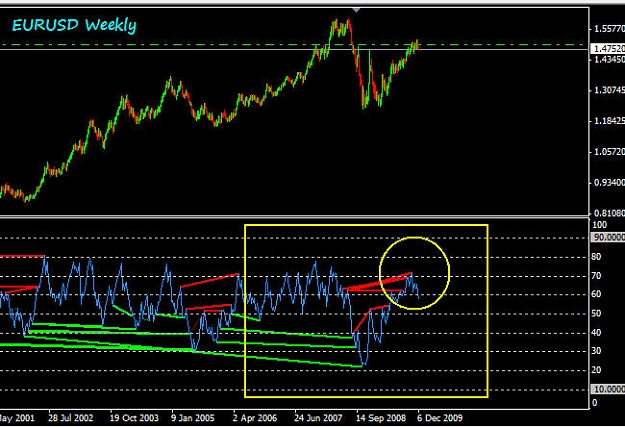
Weighing in on EURUSD — Momentum on Daily charts is all upward with no resistance at the moment. Price is moving up steadily on Weekly but momentum in the form of resistance is present. I am long on the Daily. Making profits short term on the ...
EURUSD
- pdean123 replied Aug 24, 2009
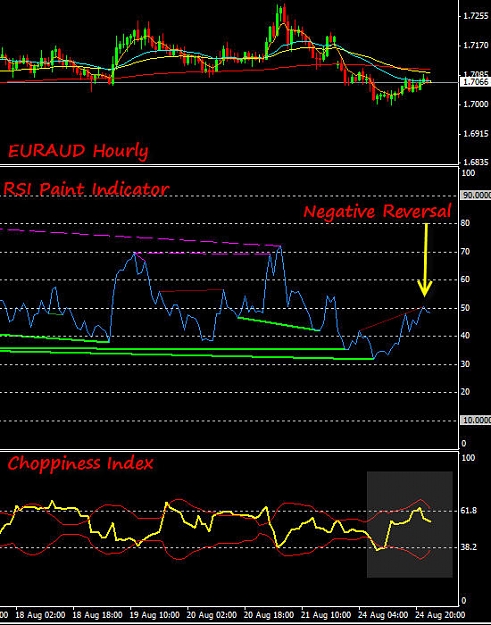
A Way To Prevent False Signals — Here is a way to prevent false signals, the Choppiness Index. Google "Choppiness Index" for more on it.
The RSI Trade
- pdean123 replied Aug 19, 2009
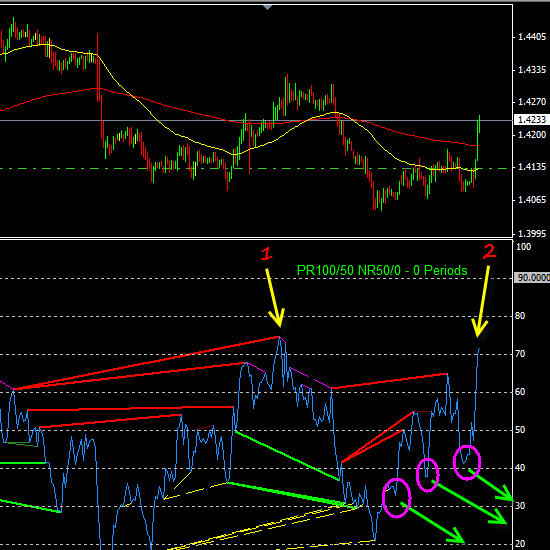
Euro Trade Today — 1. Point 1 is the peak of the mountain on RSI. 2. Climbing down the mountain there are points where we see through the RSI and our own analysis of where the mountain peaks are formed. 3. Once the mountain has been formed a ...
The RSI Trade
- pdean123 replied Aug 19, 2009
Aussie Trade today — 1. The RSI is set to record all Positive Reversals and Negative Reversals the Range specified for bullish and bearish reversals. 2. The Red arrow points to the first point of the RSI. If you look closely you will see RSI ...
The RSI Trade