- Search Crypto Craft
- 118 Results (7 Threads , 111 Replies )
- pa18 replied Nov 22, 2022
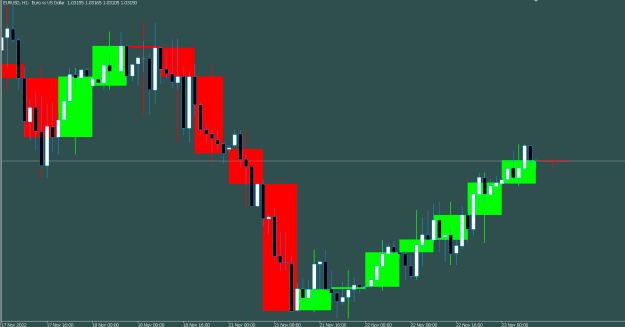
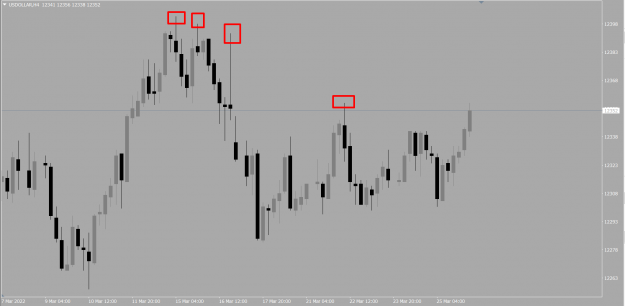
Is there a M Candles like indicator in TV? image This MT4 one is very clear. But the similiart ones I've found in TV aren't, they're horrid.
TradingView Discussion
- pa18 replied Nov 21, 2022
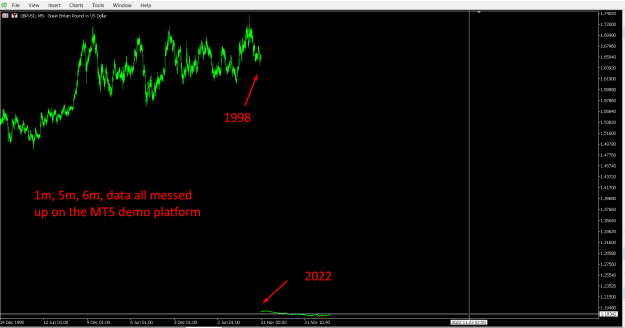
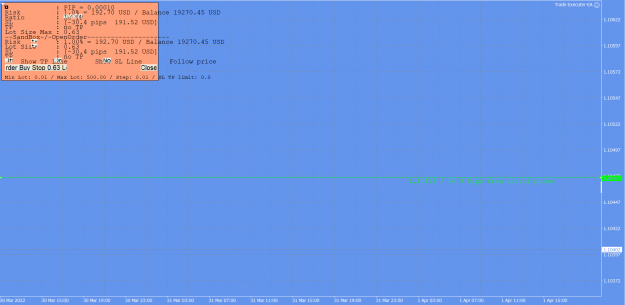
If Pepperstone is here, please check your data MT5 image
Pepperstone Forex
- pa18 replied Nov 18, 2022
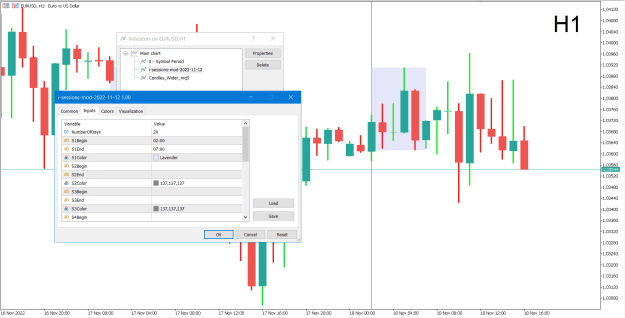
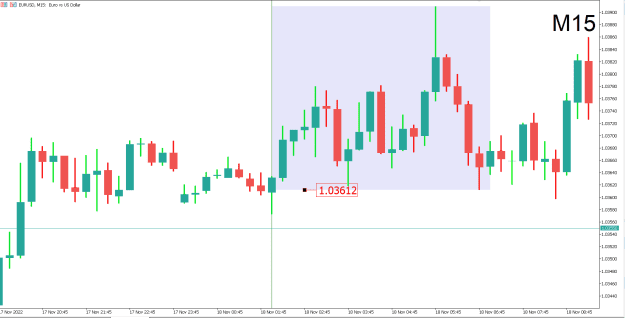
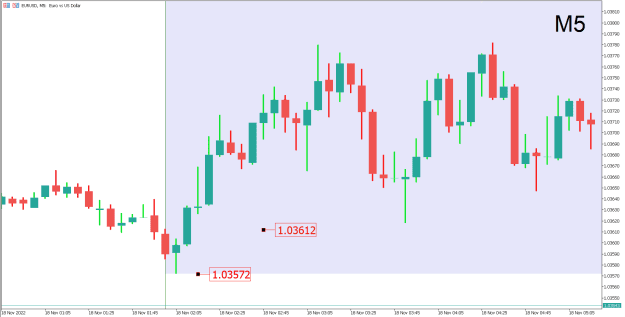
Are there any MQL5 programmers here that can help me with the following session indicator? From 15 min upwards, the start and end of a desired session, the indicator calcs a strange level, from the low or high of the first candle of the start of the ...
I will code your EAs and Indicators for no charge
- pa18 replied Jul 8, 2022
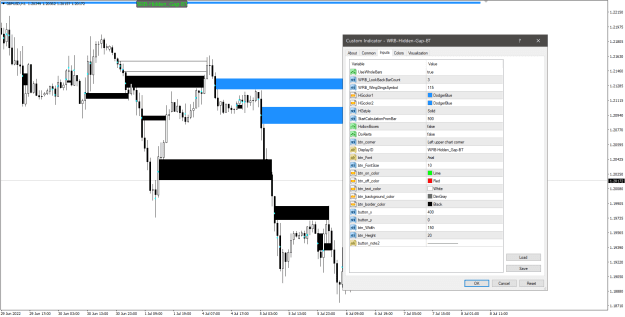
Hi BlueRain, stuck the indi on but there doesn't seem to be any changes? image
I will code your EAs and Indicators for no charge
- pa18 replied Apr 10, 2022
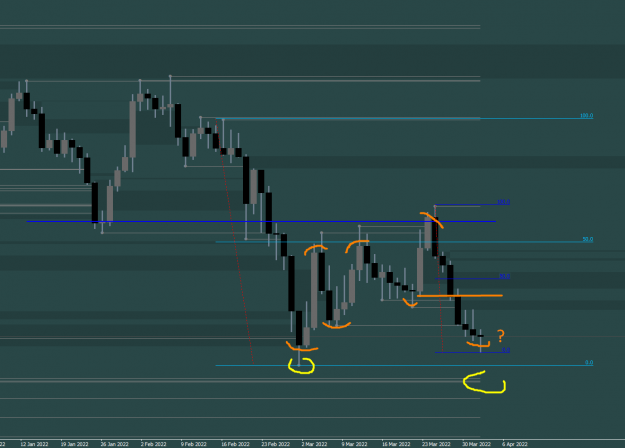
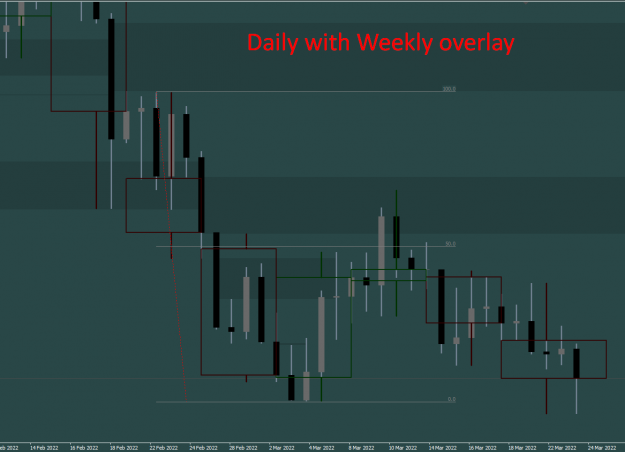
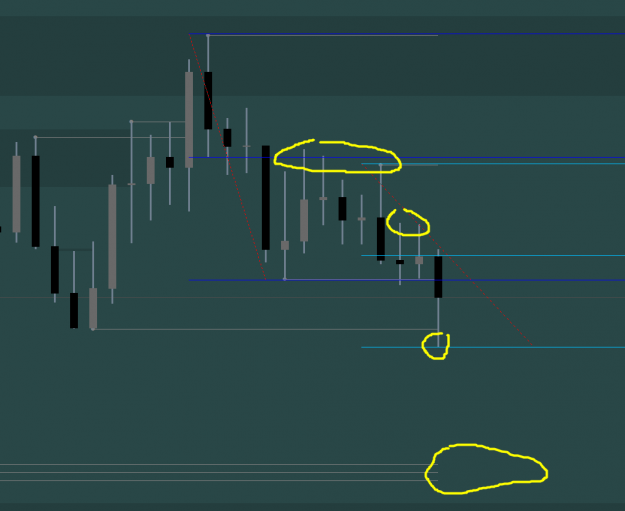
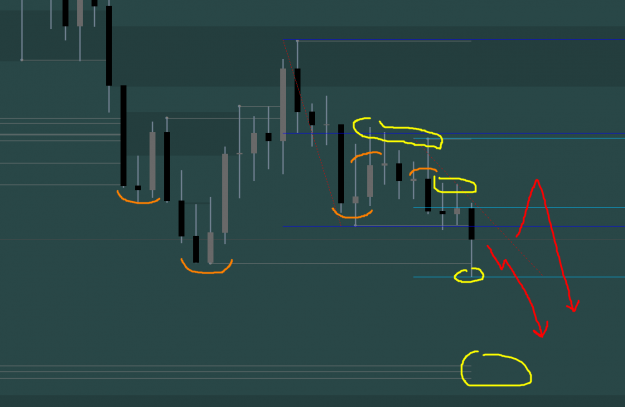
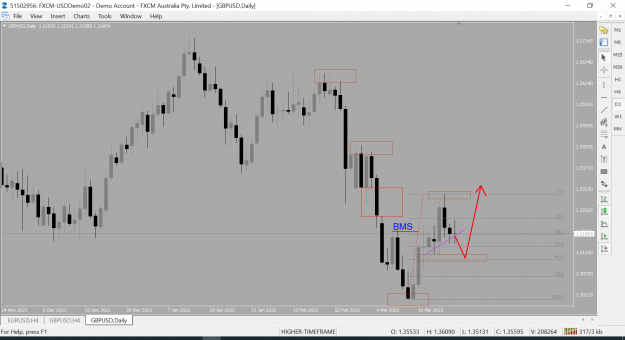
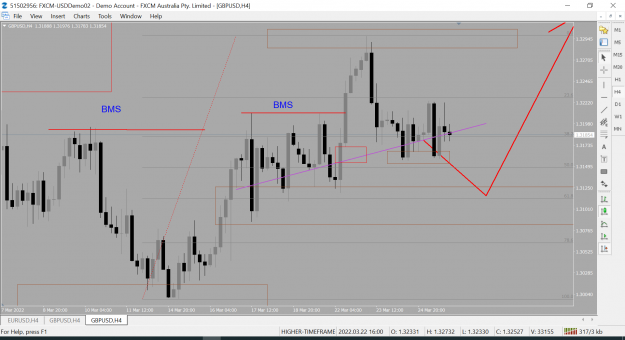
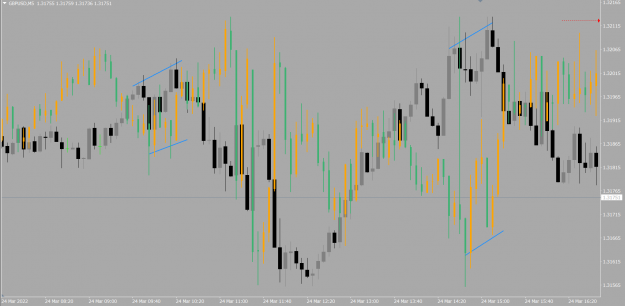
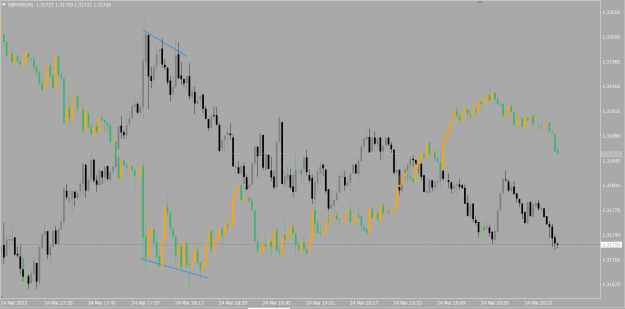
OK, I have a GU bias for daily. image image image GU daily bounced off short term sell stops liquidity. Expecting D to have some up days before down.
1M Price Action System
- pa18 replied Apr 7, 2022
Questions, from an ICT technical standpoint, are we including wicks in the analysis, which is better? Kind of confusing with ICT flip-flopping with marking up from bodies or wicks. I know for dealing ranges he includes wicks but with other fib ...
1M Price Action System
- pa18 replied Apr 1, 2022
Hi bilal1947, I've been trying out the EA but this is how it is showing on my system. image Do you or anyone know why? Sometimes, on other MT4 indicators I get font and spacing problems and I have no idea how to solve it because there are no ...
1M Price Action System
- pa18 replied Mar 31, 2022
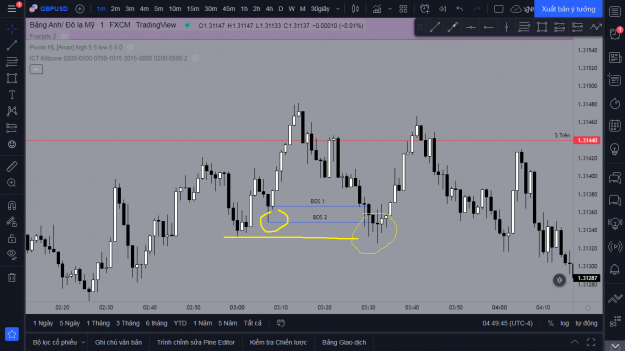
See the crazy amount of confluence? H1 is very clear of BOS, retrace, FVG on m30 and H1. Purple is 5min fvg. image
1M Price Action System
- pa18 replied Mar 28, 2022
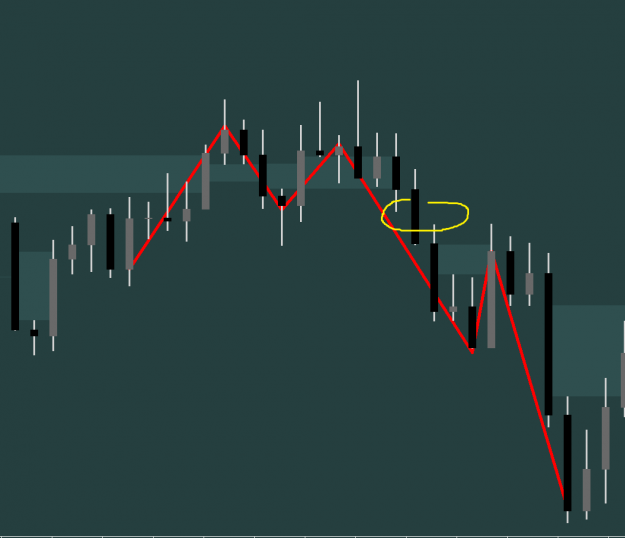
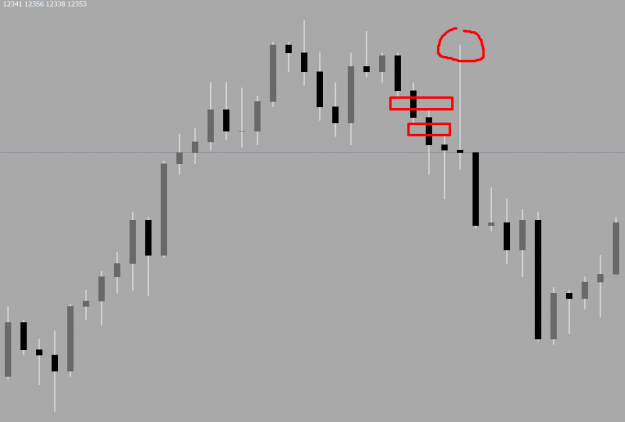
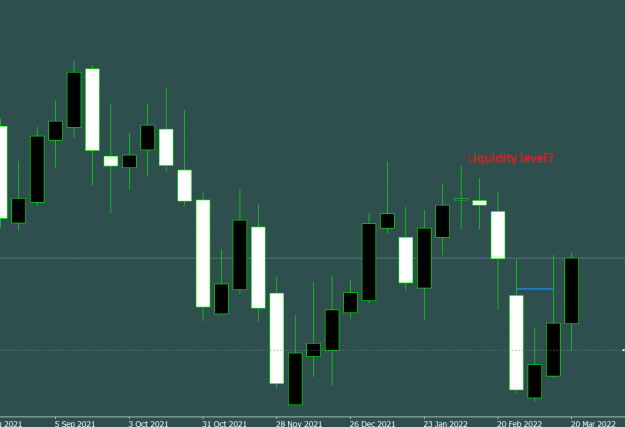
Apologies, it's a H4 dollar index. I was just asking if that's top of the spike is a liquidity area after taking out the FVGs, not about what's left of that. image
1M Price Action System
- pa18 replied Mar 27, 2022
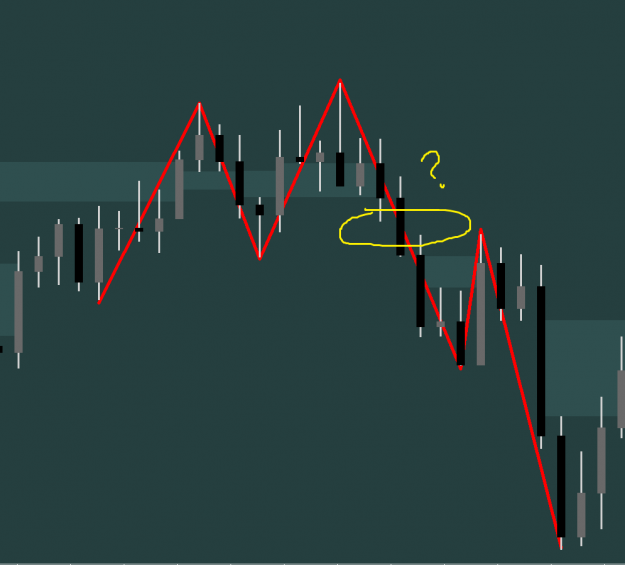
Question, imbalances have been filled so that top of the down spike is the next liquidity? image
1M Price Action System
- pa18 replied Mar 27, 2022
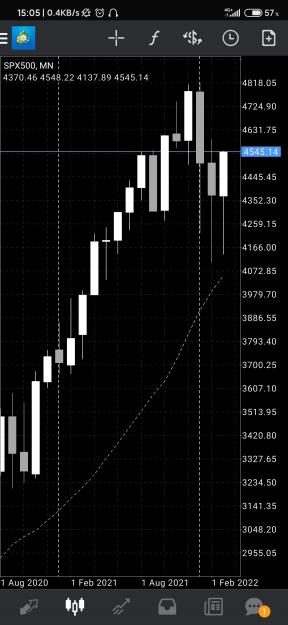
S&P breaks structure. image And since they need to, they must, they have to, crash their fiat debt system, this is probably why ICT is so desperate to help as many as he can. image
1M Price Action System

- pa18 replied Mar 26, 2022
I have a daily up bias looking like this: image H4 in an up channel image But that's a scary big ass down tail on the week though
1M Price Action System
- pa18 replied Mar 24, 2022
A bit more advanced, but do you guys use ICT SMT correlation/divergence on a small timeframe?
1M Price Action System image image Overlay is EU. Still looking for a US Dollar candle stick one.
- pa18 replied Mar 23, 2022
EU Asia is in a nice range. Waiting for the market to show their hand. I see plenty of lower fvgs to be gobbled up.
1M Price Action System image
image
- pa18 replied Mar 23, 2022
My opinions: HTF is king image image Actually some nice areas to target if I was watching this ccy pair. image image Those are my ideas. Maybe I am wrong
1M Price Action System EDIT: last chart is a weekly
- pa18 replied Mar 22, 2022
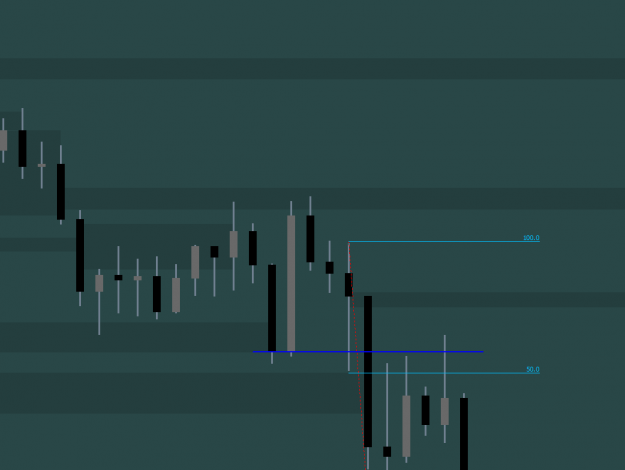
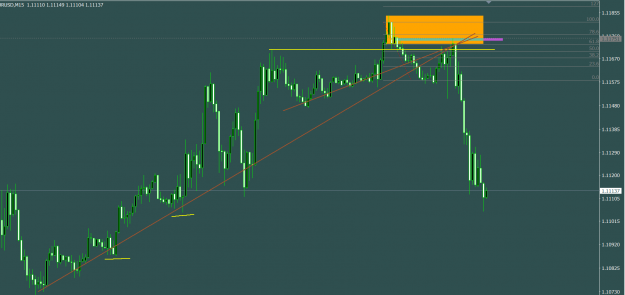
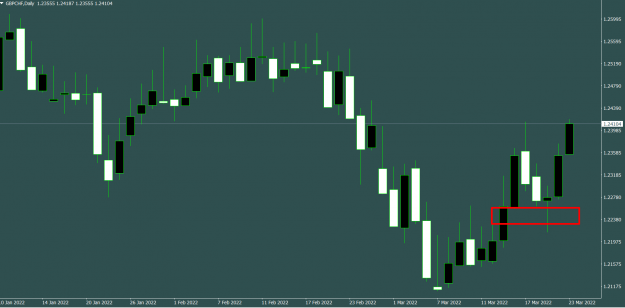
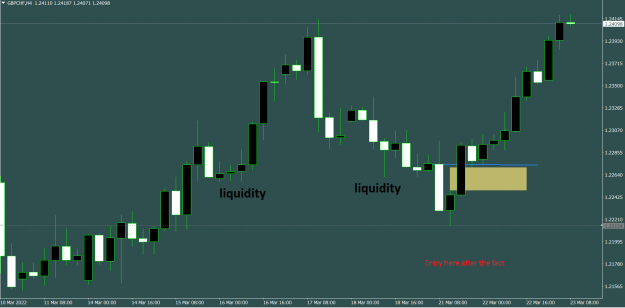
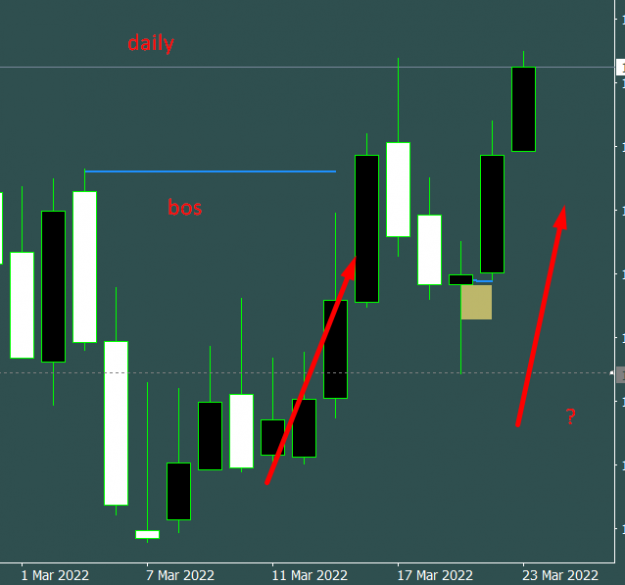
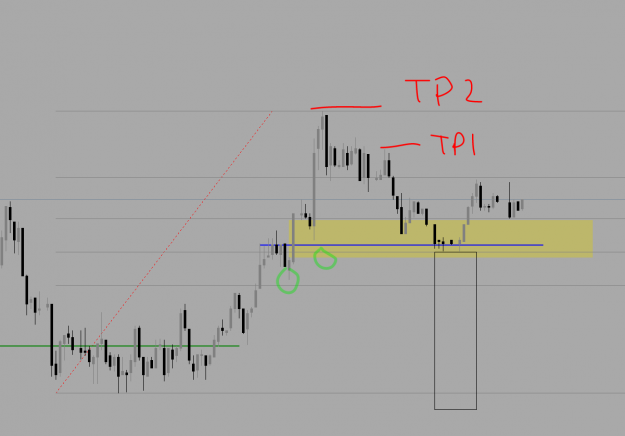
A question for the experts: image Yellow is a FVG. Confluence of 50% fib. Not a discount though (not sure if I can still take this long if not discount??). I believe the blue line is an orderblock. I want to give all the chances of the trade to go ...
1M Price Action System
- pa18 replied Mar 22, 2022
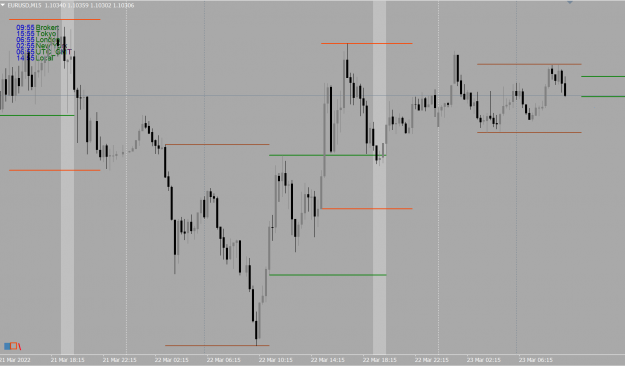
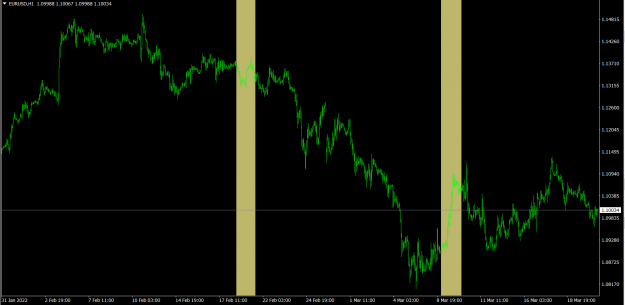
Hey anyone, is there a MT4 indicator that does the following: image Just a simple indicator to mark up a vertical blocks on the chart at designated intervals? Thanks! Found something. Thanks!
I will code your EAs and Indicators for no charge
- pa18 replied Mar 22, 2022
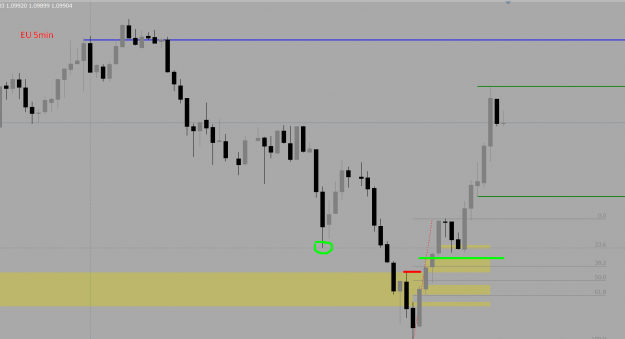
I was also prepared for EU and expected it to drop to the green line for limit buy. But too late, it went up from the top most yellow area. Drilled down to the 1 min and there was a 1 min FVG!
1M Price Action System There's also confluence at the 23.6% level ...