- Search Crypto Craft
- 24 Results
- nae replied Aug 10, 2016
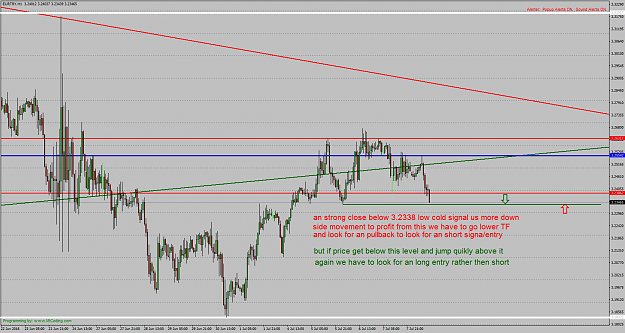
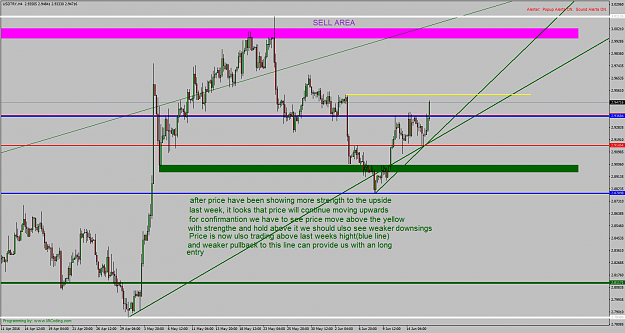
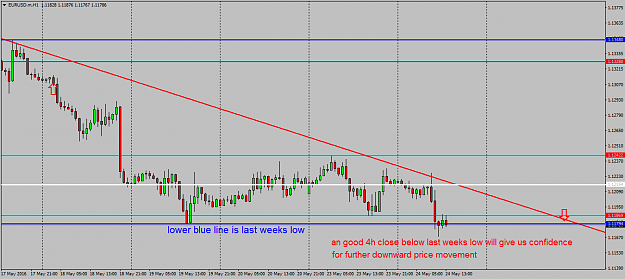
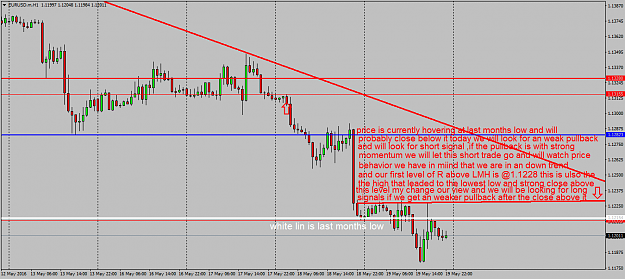
image Red horizontal lines are yestardays High/low. Blue horizontal lines are last weeks high/low. White horizontal lines are last months high/low.
USD/TRY
- nae replied Jul 8, 2016
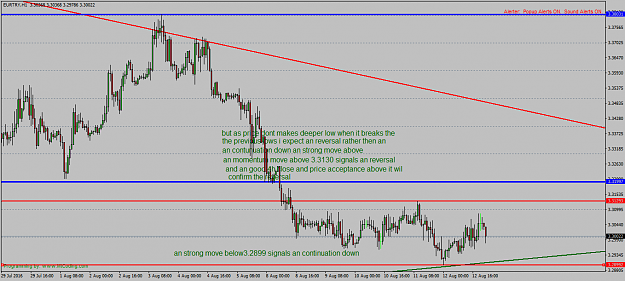
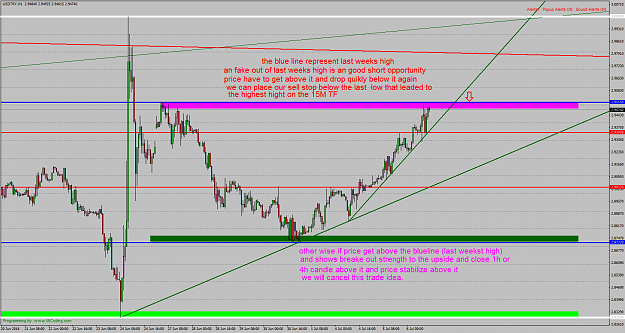
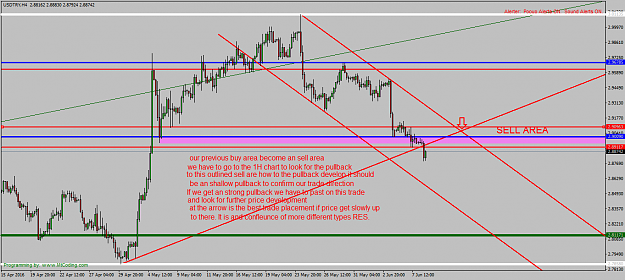
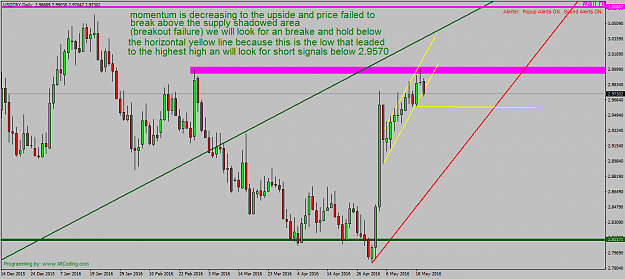
image if we get the short singal we may target the 3.19 level the next important demand level is between 3.1850 and 3.1770 when price arives there we have to look at price behavior and look for further price direction.
USD/TRY
- nae replied May 24, 2016
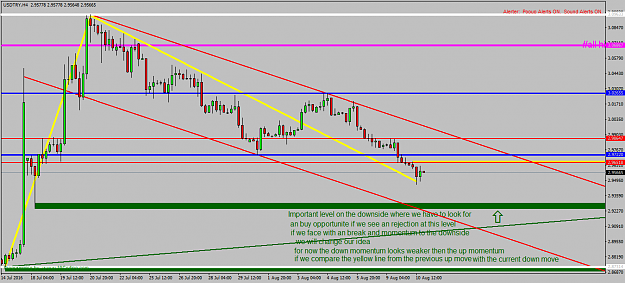
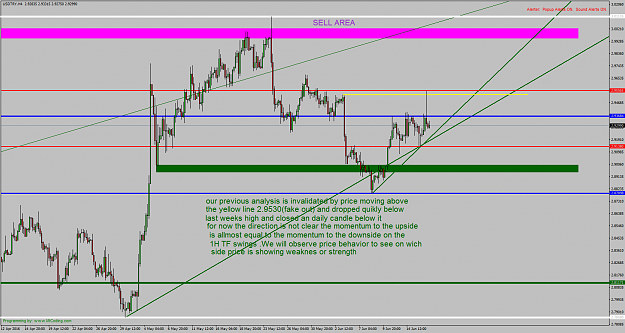
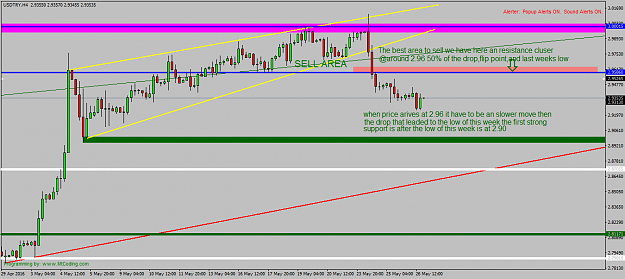
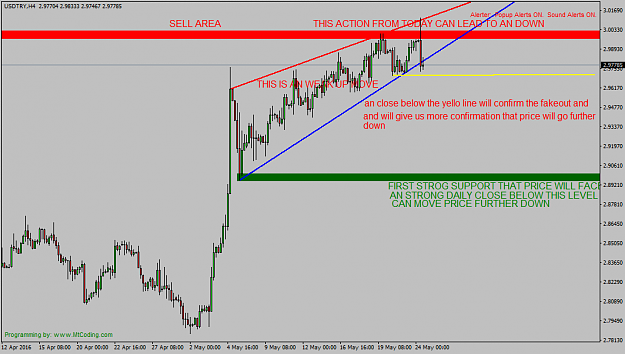
image the poeple that like my analysis can please send me feedback ,that will motivate me to post more charts
USD/TRY
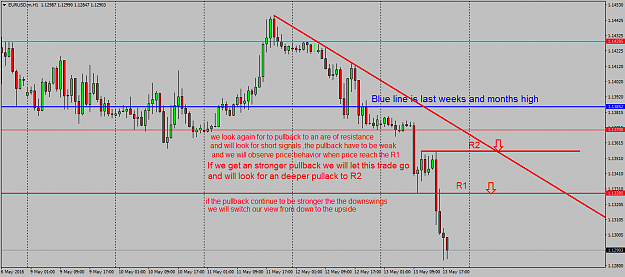
- nae replied May 13, 2016
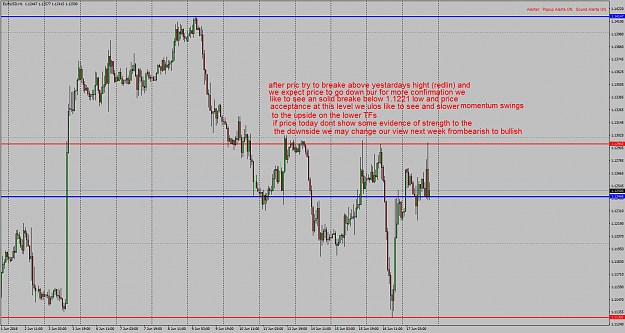
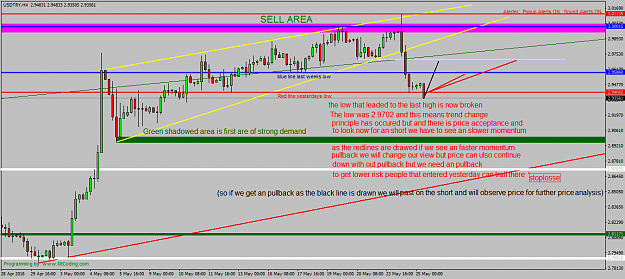
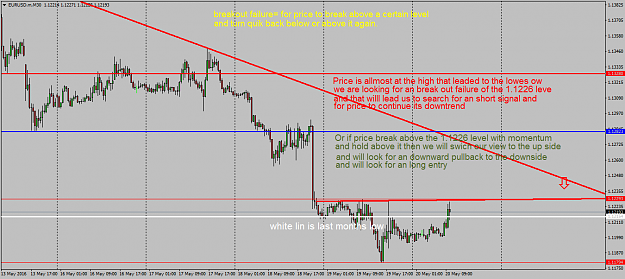
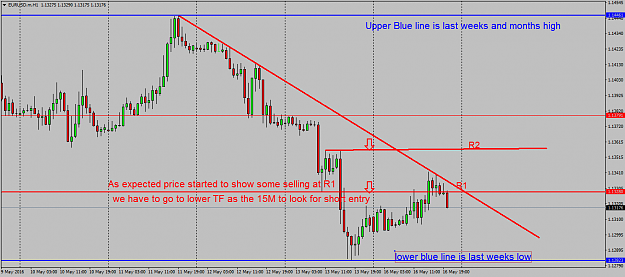
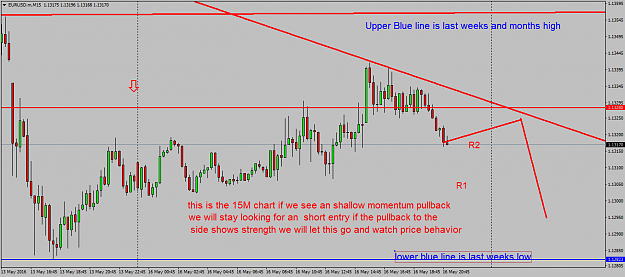
When price come to the R1 we will swinch to lower TF as the 15M or 5M to look if we see momentum to the downside in the downswings and we will compare the downswing with the previous downswing and the current downswing with the last upswing to give ...
EURUSD
- nae replied Dec 14, 2015
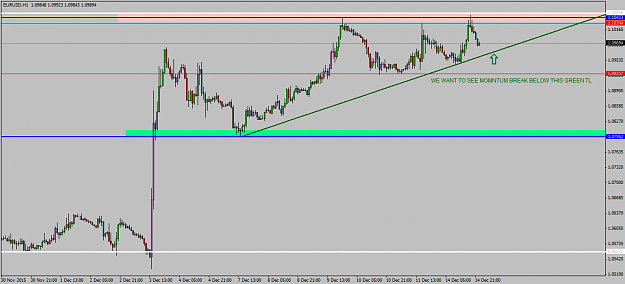
This is the 1h eurusd chart.Price is still hanging around below resistance/supply area and is not showing any momentum to the downside im looking for price to break below the upwards sloping tl and will look for an short signal after the break and ...
EUR/USD: IntraDay Scalping and Short Term Swing Trading Only