- Search Crypto Craft
- 572 Results
-
 my2buoys replied Feb 4, 2008
Actually there are several here. Threads should be cleaner than chatrooms by nature. I understand there are a number of people to whom English is not their first language. I was actually thinking of recent posts by Sycho and even Orion, but there ...
Auslanco - GBP/JPY and GBP/USD (newstrade)

- my2buoys replied Feb 4, 2008
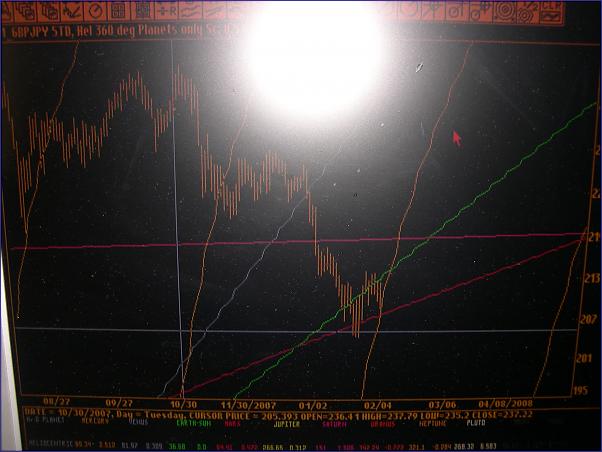
Sorry crap pic, this is pic of geppy day chart with planetary positions, mars(red) is currently acting as support as well as mercury (orange). Yo, Orion, I don't see Mars or Mercury on your chart but I do see a big white light, possibly an asteroid, ...
Auslanco - GBP/JPY and GBP/USD (newstrade)
- my2buoys replied Jan 24, 2008
We are definitely on target according to this Monthly chart. M2B
Auslanco - GBP/JPY and GBP/USD (newstrade)
- my2buoys replied Jan 23, 2008
The Weekly 5SMA Low is around 212.15 and Weekly Momentum calls for price to move in that direction. There's only two days left but I think it's very possible. M2B
Auslanco - GBP/JPY and GBP/USD (newstrade)
- my2buoys replied Jan 23, 2008
Hmmm. A little torn here. I'm really expecting to see that Monthly 50 Fib at 200 hit, but it seems like it might be delayed until possibly next month. The Daily QQE has just crossed up and confirmed bullish on my charts. The last time this happened ...
Auslanco - GBP/JPY and GBP/USD (newstrade)
- my2buoys replied Jan 23, 2008
Sorry so late. I needed a break from my computer. I already answered this on the page right before your question. 4H divergence will yield anywhere from 300 to 700 pips, with the average being 500 pips (right in the middle). Remember, divergence is ...
Auslanco - GBP/JPY and GBP/USD (newstrade)
- my2buoys replied Jan 22, 2008
I like your chart, aediaz. I don't follow wave patterns enough to know how accurate your D point might be, but I do like price retracing down to the 50 Fib around 207.60. That area is also right around the 4H 5SMA low and the 5SMA close on both the ...
Auslanco - GBP/JPY and GBP/USD (newstrade)
- my2buoys replied Jan 22, 2008
I'm pretty sure the "Big Ben" he's referring to is this guy pictured here...'cause we don't have any double-deckers here in the US, except for possibly San Francisco, which is a country unto itself anyway. M2B
Auslanco - GBP/JPY and GBP/USD (newstrade)

- my2buoys replied Jan 22, 2008
I don't use just the current direction of the histogram or MACD lines to determine divergence. I use two 'peaks' or 'valleys' to draw my lines. The only current divergence I see on GBP/USD is on the 4H chart, and price has moved up 300 pips from ...
Auslanco - GBP/JPY and GBP/USD (newstrade)
- my2buoys replied Jan 22, 2008
See, that didn't last long. M2B
Auslanco - GBP/JPY and GBP/USD (newstrade)

- my2buoys replied Jan 22, 2008
A direct hit on the 61.8 Fib. M2B
Auslanco - GBP/JPY and GBP/USD (newstrade)
- my2buoys replied Jan 22, 2008
Whoa! 200 pips in 1 MINUTE with no direct news to blame. Gonna be volatile today. M2B
Auslanco - GBP/JPY and GBP/USD (newstrade)
- my2buoys replied Jan 17, 2008
Here is a look at the Monthly and Weekly charts, showing the Monthly 50 Fib level at 199.64. It's technically possible, depending on fundamentals over the next two weeks, that we could see 200 by the end of the month. The weekly is OS on ...
Auslanco - GBP/JPY and GBP/USD (newstrade)
- my2buoys replied Jan 17, 2008
I realize my post is late, but I'm not sure why so many of you are/were pushing for the 213+ area even earlier. Here are two charts, the 4H and the 1H, showing that we did not have a close on either of these TFs above the 50 Fib at 212.15. It's hard ...
Auslanco - GBP/JPY and GBP/USD (newstrade)
- my2buoys replied Jan 14, 2008
GBP/JPY Monthly — I do believe it's highly likely/possible we'll see 200, which is the 50 Fib, by the end of this month. There are two weeks left in January, RSI has room to move down before becoming OS, and MACD is showing good separation and ...
Auslanco - GBP/JPY and GBP/USD (newstrade)
- my2buoys replied Jan 14, 2008
This guy(?) said he'd like to vouch for ya'.
Auslanco - GBP/JPY and GBP/USD (newstrade)

- my2buoys replied Jan 10, 2008
I don't see how price could go down without first going up. Open up your chart to a 4H instead of a 1H and you'll see we've been in a range since the first of the year. Price has bounced between 213.50 and 217 as highlighted by the space between the ...
Auslanco - GBP/JPY and GBP/USD (newstrade)
- my2buoys replied Jan 10, 2008
Here's a Daily Chart. Price is still trying to decide which way to go for the moment. Notice how flat the Stochastics, Stoch/RSI and all of the Momentums are. Notice also that price has already run the gamut for the day. It opened near the 5SMA ...
Auslanco - GBP/JPY and GBP/USD (newstrade)
- my2buoys replied Jan 10, 2008
Nothing new. I posted a couple of charts at the beginning of the week with my projections. GBP/JPY has basically been ranging all week so far. I do think, based upon weekly momentum, that price will reach 220 this week. It's possible that because of ...
Auslanco - GBP/JPY and GBP/USD (newstrade)
- my2buoys replied Jan 10, 2008
...unless you had one of these next to your computer the whole time...
Auslanco - GBP/JPY and GBP/USD (newstrade)