- Search Crypto Craft
- 12 Results
Attached Image

-
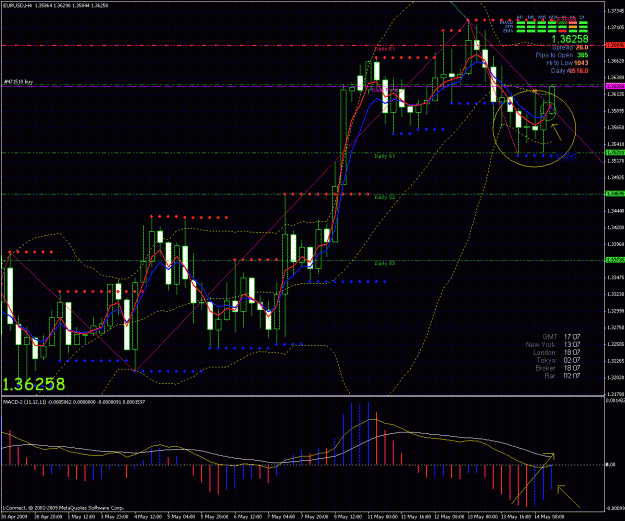
 moh.ezzat replied May 14, 2009
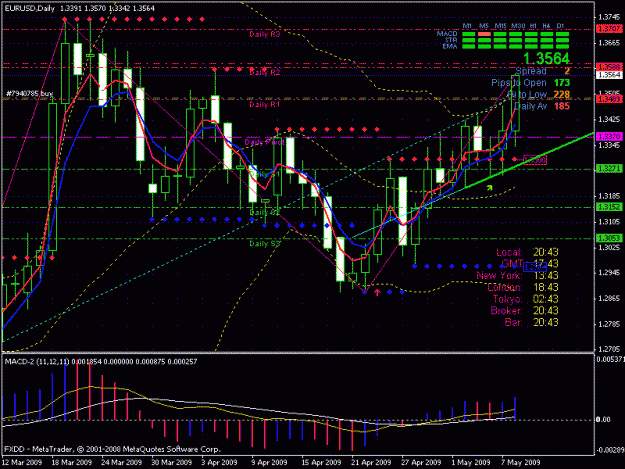
The one saying its a BULL trap (can he tells me what does that means!!?)
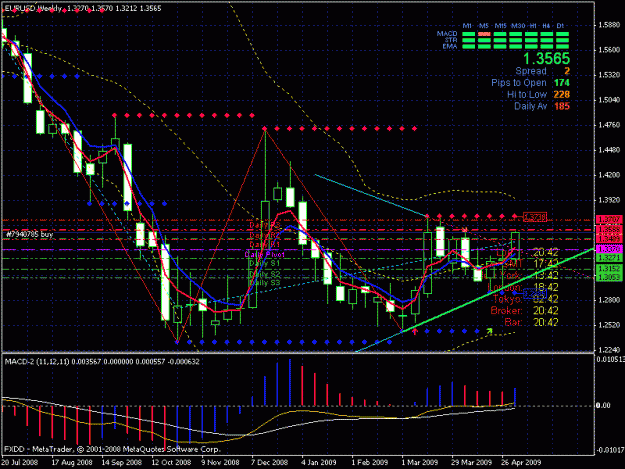
EURUSD
Attached Image (click to enlarge)
Attached Image (click to enlarge)
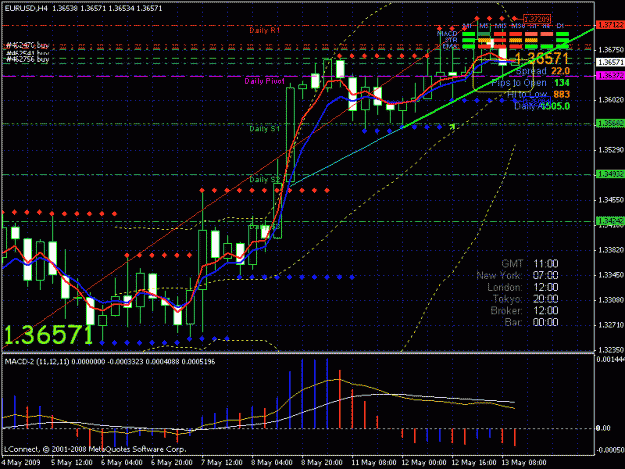
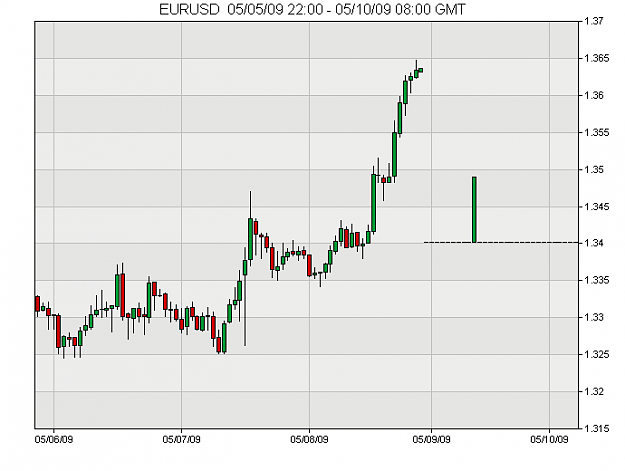
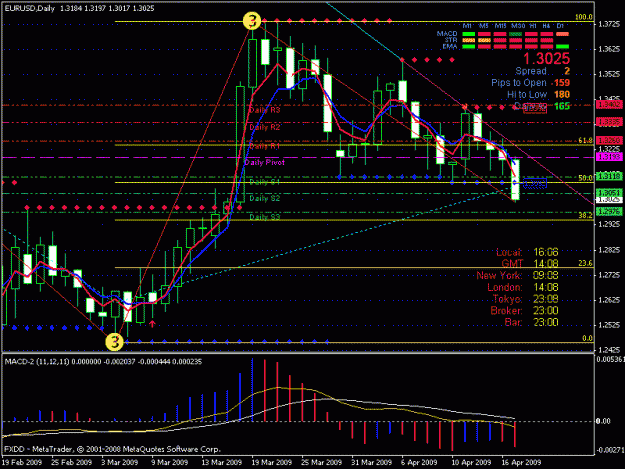
- moh.ezzat replied May 10, 2009
the trend line is UP if it reached 1.34 it will just bounce from there or goes down to hit the trend line and correct back to 1.37
EURUSD
Attached Image (click to enlarge)
Attached Image (click to enlarge)
Attached Image (click to enlarge)
Attached Image(s) (click to enlarge)
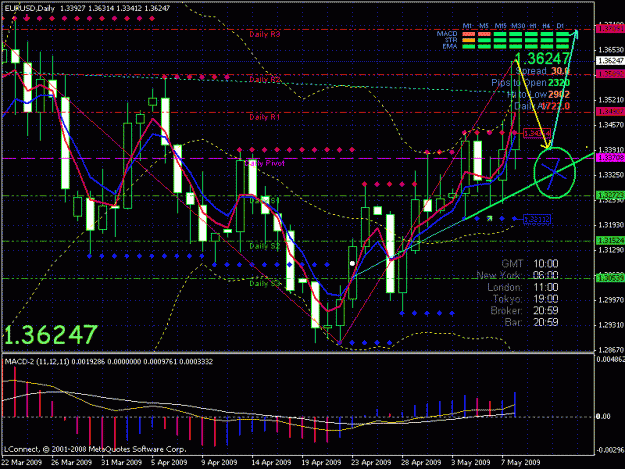
- moh.ezzat replied Apr 28, 2009
a doji star and a dark shadow candle maybe its a signal for a reverse
EURUSD
Attached Image (click to enlarge)
Attached Image (click to enlarge)
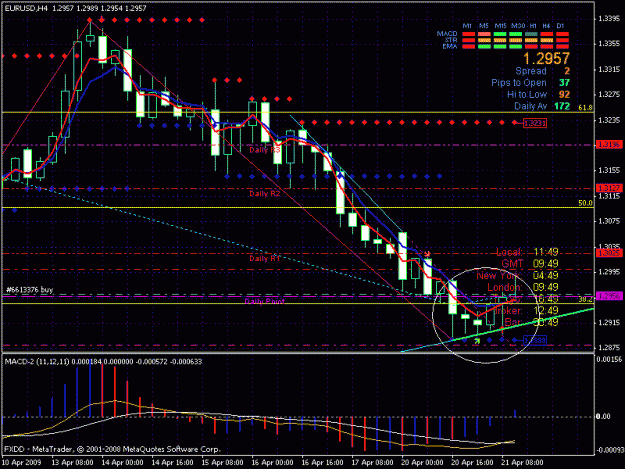
- moh.ezzat replied Apr 19, 2009
that is my daily chart analysis Buy @ 1.2947 TP1 @ 1.3140 TP2 @ 1.3300
Misr-Group
Attached Image (click to enlarge)
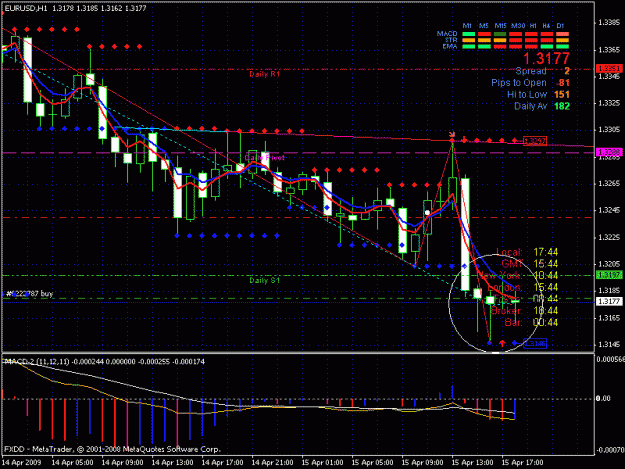
- moh.ezzat replied Apr 15, 2009
2 morning stars and two Doji stars indicating a very strong bullish market
EURUSD TP @ 1.3240 SL @ 1.3100
Attached Image (click to enlarge)
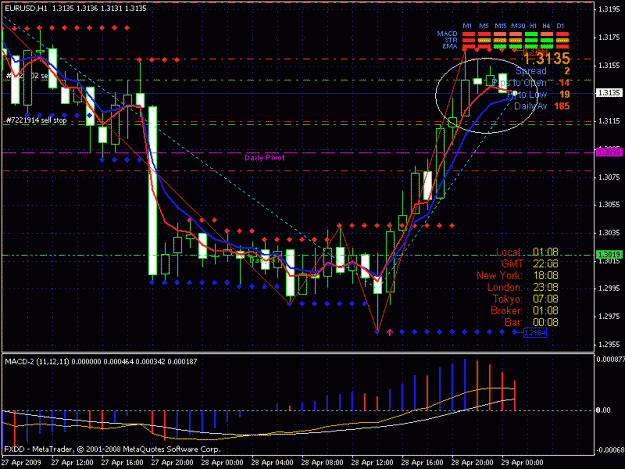
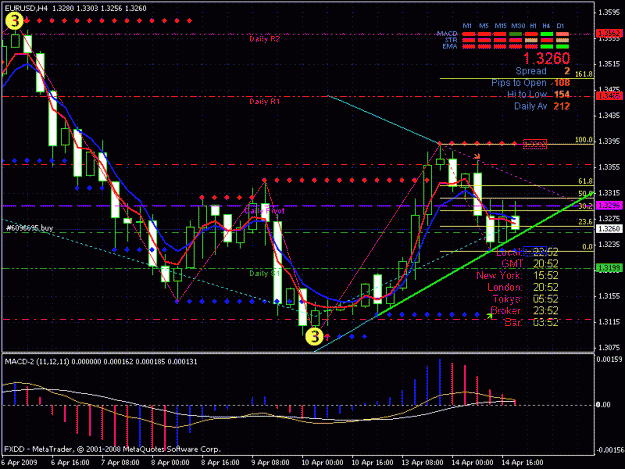
- moh.ezzat replied Apr 14, 2009
The 4H chart indicates a strong bullish market if the next candle after 5 min goes bullish and moves with the trend line, the EMA is down in all charts the MACD is down and getting up on the 1H chart, Therefore go long TP @ 1.3350 SL @ 1.3150
EURUSD
Attached Image (click to enlarge)
- Posts by Member Search: 'moh.ezzat'