- Search Crypto Craft
- 35 Results (1 Thread , 34 Replies )
- machine25 replied Jun 17, 2018
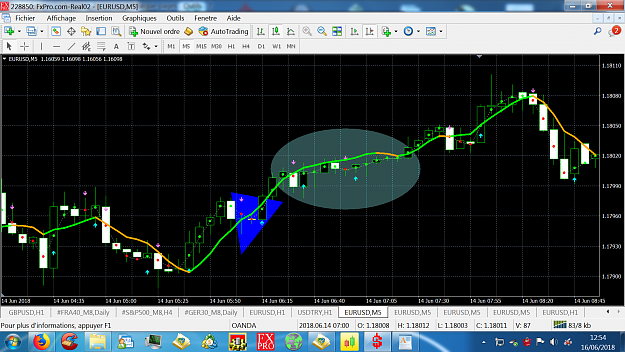
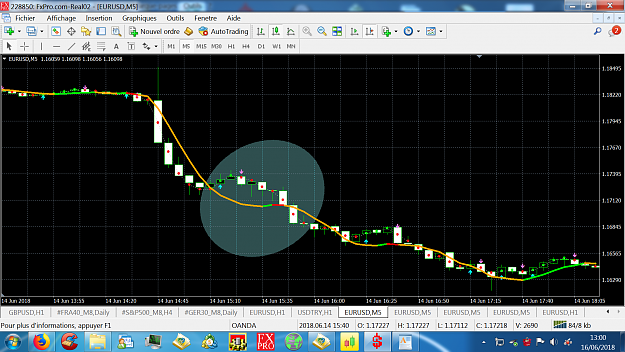
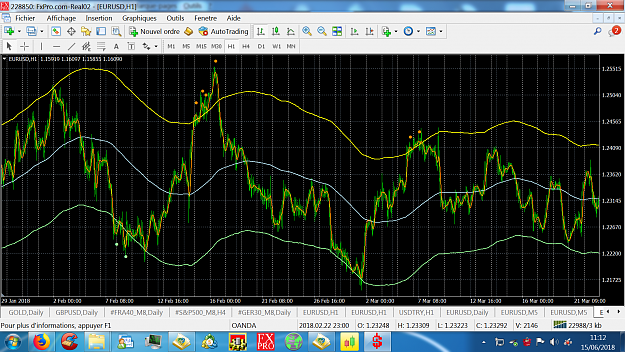
Look this is a stochastic, and this is a donchian channel So you see what is a stochastic ?
Combining indicators
- Combining indicatorsStarted Jun 16, 2018|Platform Tech|14 replies
The idea is to filter an indicator by another; In case there is already a trend going on ; If i ...
- machine25 replied Jun 15, 2018
try this one ima_250_II.mq4 - (don't need NonLagMA)
I will code your EAs and Indicators for no charge
- machine25 replied Sep 1, 2017
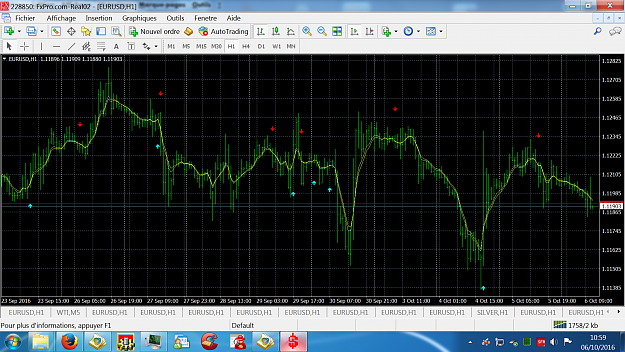
Here are the bloody f....ing sellers,
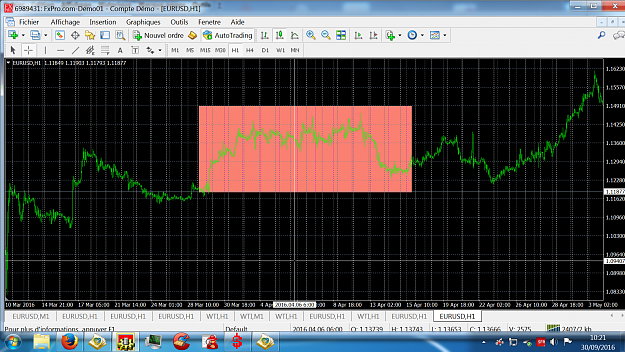
EURUSD hell, stop to sell so that the price can go down Thank to the guy who gave the link
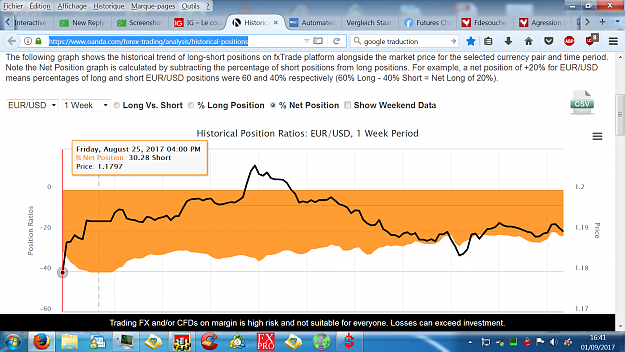
- machine25 replied Sep 1, 2017
Hunting Stops This mean that "they" want the price to go lower, but first they want to get rid of sellers, trigerring their stops
EURUSD
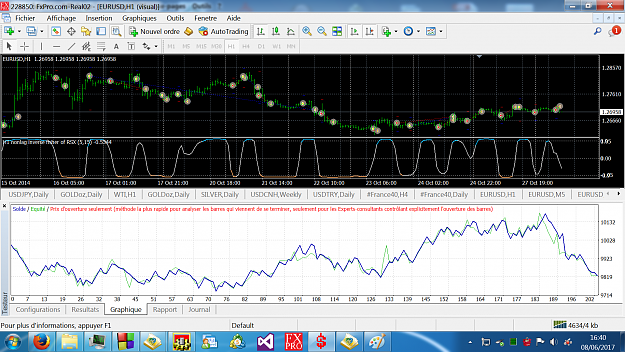
- machine25 replied Jun 8, 2017
If someone is willing to develope a strategy, here is the way to get the signal, and take the orders : image
NonLag inverse fisher transform of RSX
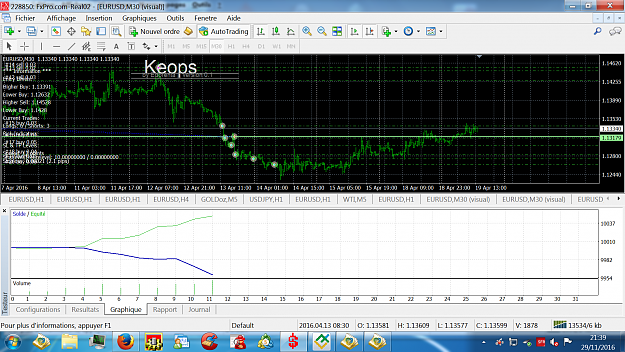
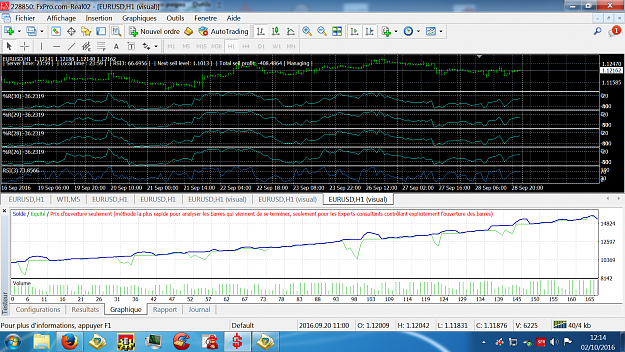
- machine25 replied Nov 29, 2016
It work on five digits broker ! It stop putting takeprofit at some moment :
Some help on debugging my code please :)
- machine25 replied Oct 6, 2016
Here is an indicator which is often found in decompiled code. It use two ma, the delta is the difference in point between the two ma, and it use an RSI, there is a signal buy if delta_ma > delta and rsi > 50. And vice versa for the sell signal I ...
I will code your EAs and Indicators for no charge
- machine25 replied Oct 2, 2016
Play with these value to find better backtest, please post result : extern int rsi_per = 3; extern double RSI_BuyLevel=10; // original 1 //RSI3 value for buying extern double RSI_SellLevel=90; // original 99 //RSI3 value for selling extern int ...
I will code your EAs and Indicators for no charge
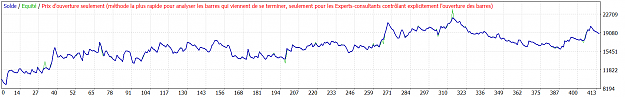
- machine25 replied Sep 30, 2016
Here is what is killing this kind of strategy :
Scalping Expanding Hedged Grid
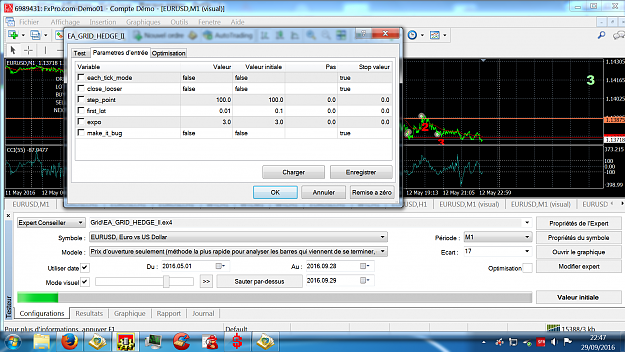
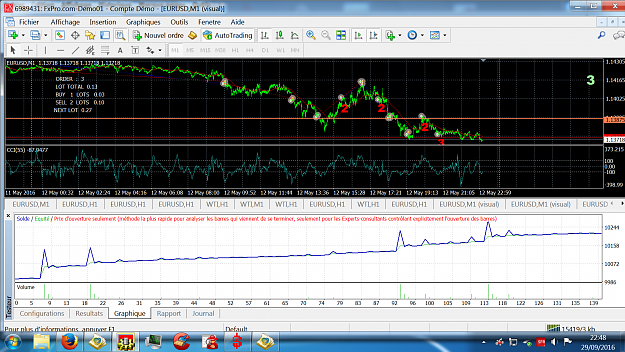
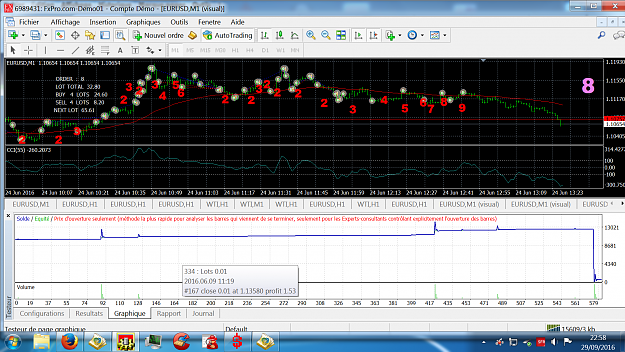
- machine25 replied Sep 29, 2016
I believe this is not a grid hedged, because when you open a first buy (1 lot) and you open a sell (3 lot), it's the same as if you close the buy and open a sell(2 lot). I believe it is no a grid either, but a martingale. The previous EA I posted ...
Scalping Expanding Hedged Grid
- machine25 replied Jul 4, 2016
change the head of your indicator for this one : double VolLowest,Range,Value2,Value3,HiValue2,HiValue3,LoValue3,tempv2,tempv3,tempv; int i=-1, limit=-1; int counted_bars = IndicatorCounted(); //---- last counted bar will be recounted ...
I will code your EAs and Indicators for no charge
- machine25 replied Jul 4, 2016
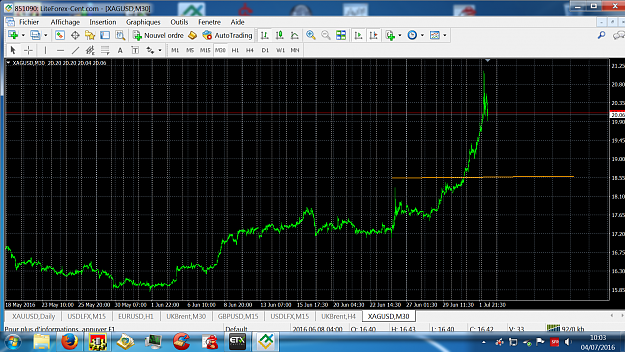
XAG is on a parabolic mode, it could retrace :
XAU/USD & XAG/USD - Gold & Silver Traders Thread
- machine25 replied Jul 1, 2016
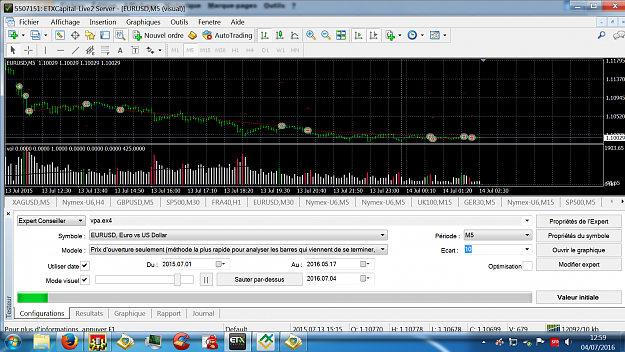
Yep, I think the market priced a rate cut, and maybe, as you say, a QE4. The movement on SP500 is counter natural, never happen a raise of 100 point on sp whitout a retracement. USD and EUR are two falling knive, the euro is falling faster until ...
EURUSD
- machine25 replied Jun 29, 2016
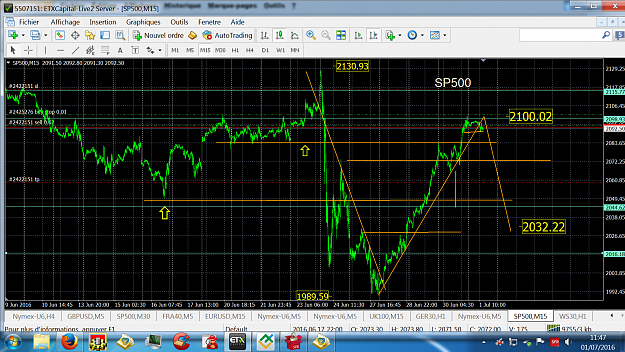
SP500 made a pull back, and retraced almost 50%. Now it should go down otherwise, we can say brexit is bull_it. Price retraced 50 % whitout any pull back Back to 2025 ??
EURUSD
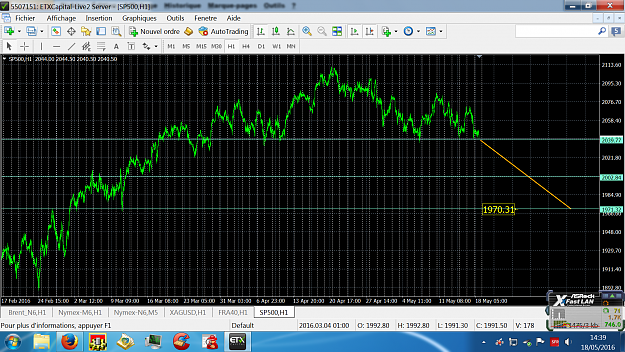
- machine25 replied May 18, 2016
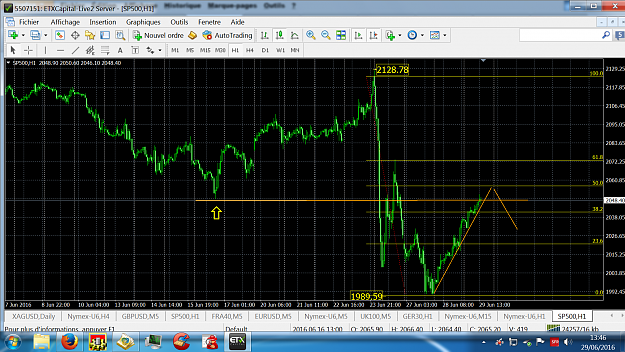
There is a big ETE on SP500, if the support break, it will go to 2000, and then to 1970. Oil then will pullback.
Oil and Natural Gas
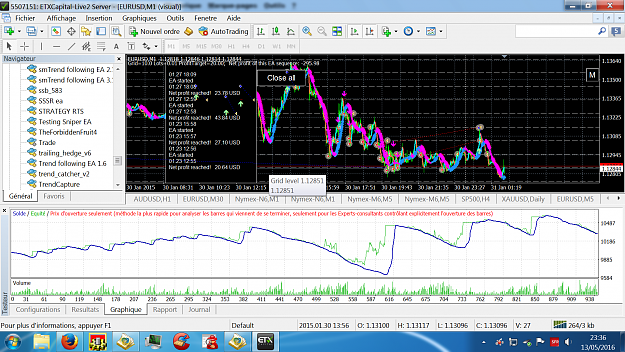
- machine25 replied May 13, 2016
Here is mine : You can play with this extern to adjust the place of the rectangle, the font size, and the y space : (compile to make effective) extern int font_size = 9; extern int move_rect_to_rigth = 0; extern int increase_space_y_number = 19; I ...
Trend grid