- Search Crypto Craft
- 269 Results
- lbtrader replied Nov 10, 2022
Hi Paolo, I am no where close to JPN or Ali, but I can try. The reason is you took the crosses either very high or very low, not the A+ setups that would favor a winning trade (even that is not a guarantee, but still...), another fact is that ...
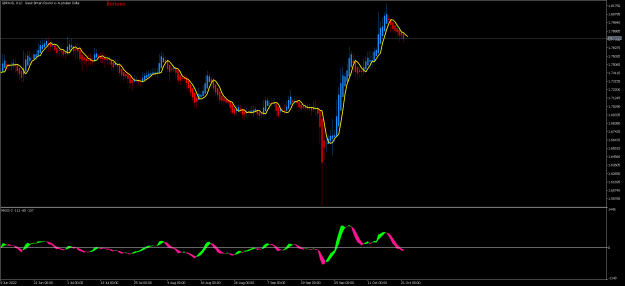
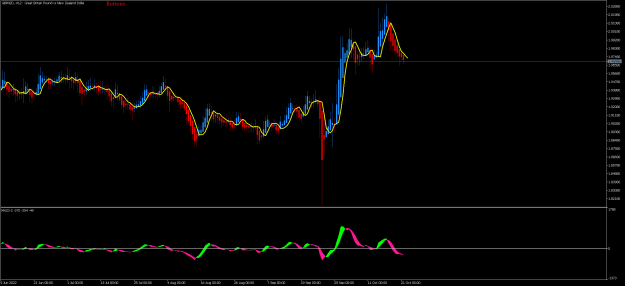
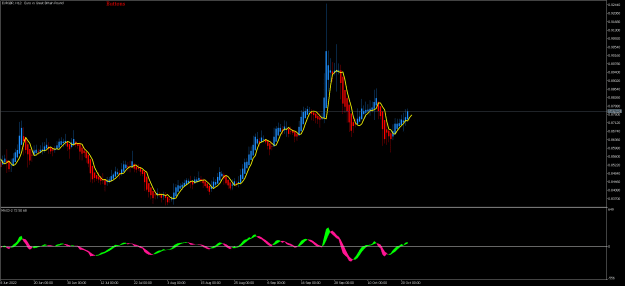
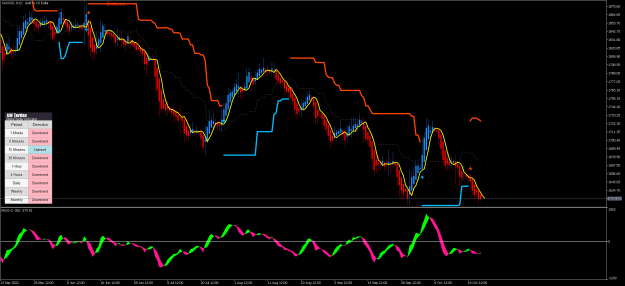
The Small Turtle System (Donchian Trend +MACD)
- lbtrader replied Oct 27, 2022
Thank you jpntrader for your insight, however the price after the first rally candle did not go back to the open price (it retraced to just below the 50 fibo level), sort of catching it's breath and consolidating for 3 candles, accumulating orders ...
The Small Turtle System (Donchian Trend +MACD)
- lbtrader replied Oct 25, 2022
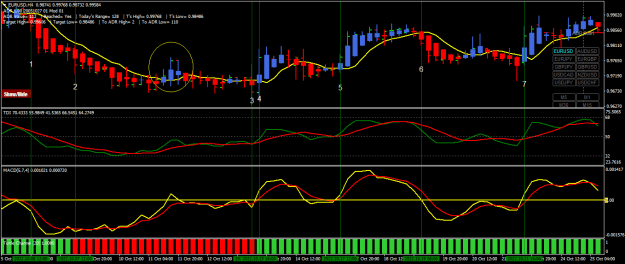
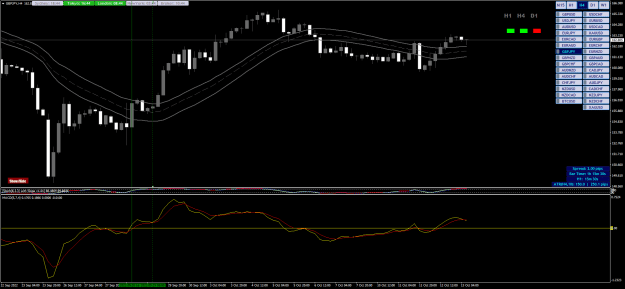
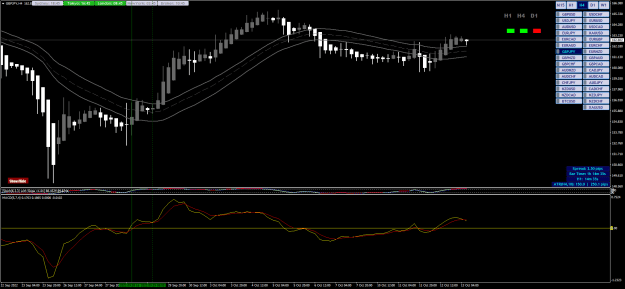
Hi cuchuflito, It seems that you are using the original donchian channel indicator rather than the turtle indicator. I tried to emulate your 12H chart with the MACD and TDI The first trigger was actually against the turtle trend. The second trigger ...
The Small Turtle System (Donchian Trend +MACD)
- lbtrader replied Oct 25, 2022
Here's an H4 chart on EU with MACD and TDI. I believe TDI can be useful in keeping you in the trade when the HA candles turn to the opposite color, however as you can see, most of the time the signals are in agreement on both, but still some ...
The Small Turtle System (Donchian Trend +MACD)
- lbtrader replied Oct 21, 2022
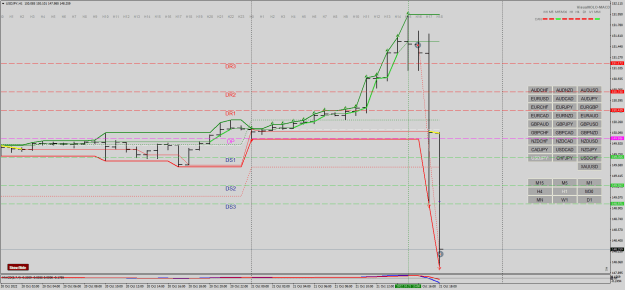
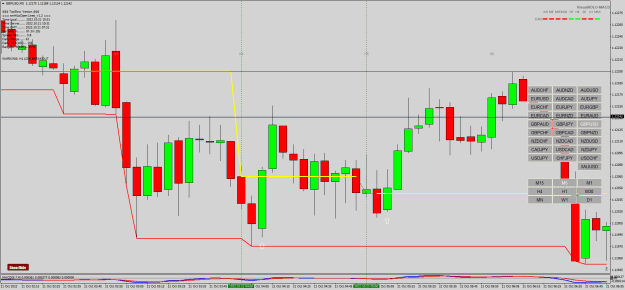
Highest Open / Lowest Open Trade
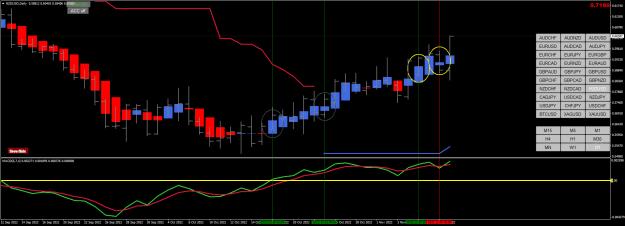
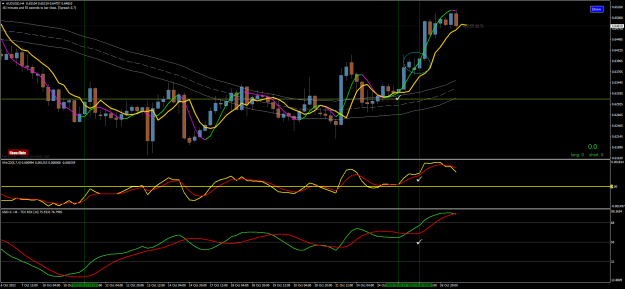
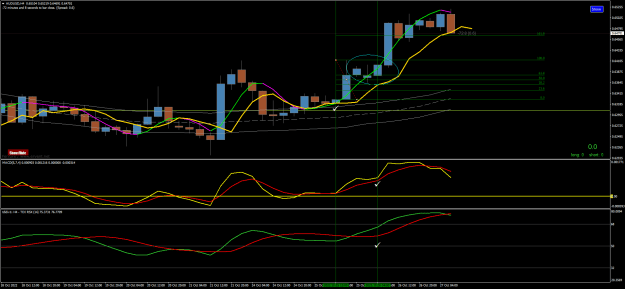
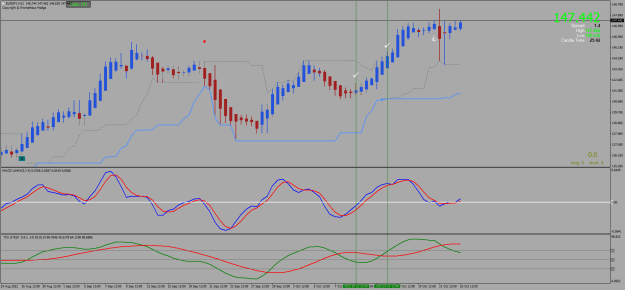
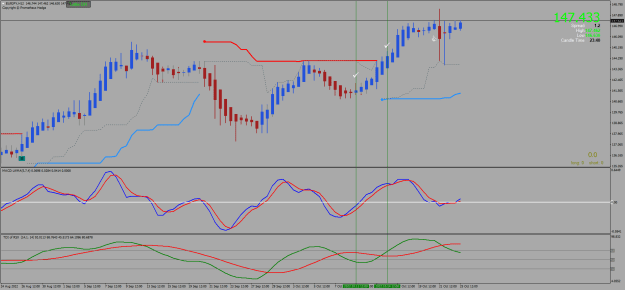
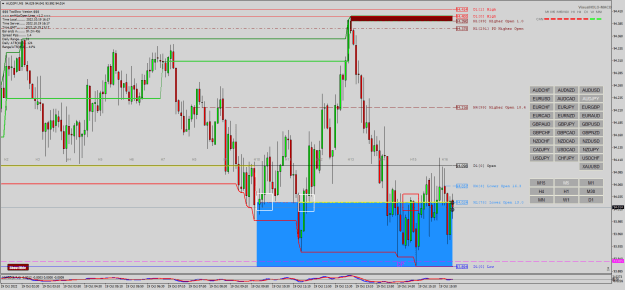
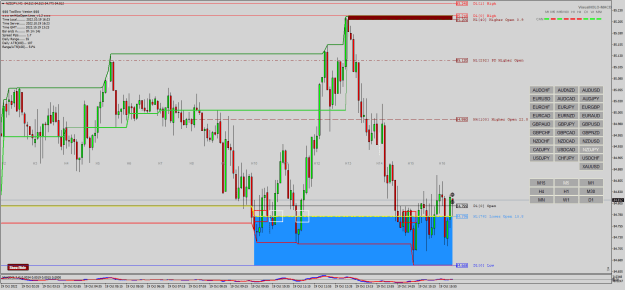
 This is a fantastic example of both HOLO and 1-2-3 play whichever method you happened to be in, this paid really well
  image image
- lbtrader replied Oct 21, 2022
Thanks cuchuflito for sharing. I will be watching/trading the 12H charts too, they look smoother and MT5 has it built in so no need to add another indicator and use offline charts, only problem I cannot find the turtle channel indicator for MT5, ...
The Small Turtle System (Donchian Trend +MACD)
- lbtrader replied Oct 21, 2022
den, the lowest H1 open can be bear or bull it doesn't matter, what matters is the open price, is it the lowest of the day or not (same for the highest open). so if your previous lowest H1 is a bear candle, and the next one is bull your H1 line is ...
Highest Open / Lowest Open Trade
- lbtrader replied Oct 19, 2022
As long as the H1 line is maintained you can enter as many times as you have valid entries. The only thing that changes as in this chart is the daily low which will increase your risk because your SL is greater so need to reduce the lot size ...
Highest Open / Lowest Open Trade
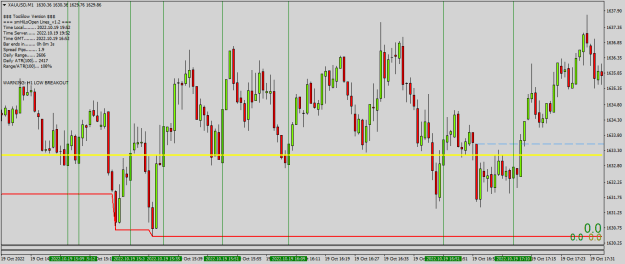
- lbtrader replied Oct 19, 2022
yes, the first break however tends to be a fake, the second break was better with no draw down at all. image
Highest Open / Lowest Open Trade
- lbtrader replied Oct 19, 2022
Price does brown down? I don't understand. in both charts you had valid entries, 4 for NJ and 3 for AJ but for some reason you chose the entries with the weakest momentum on the first entry and the one that hit your SL on the last entry. The ones ...
Highest Open / Lowest Open Trade
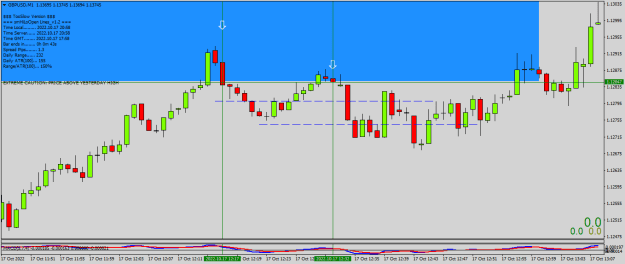
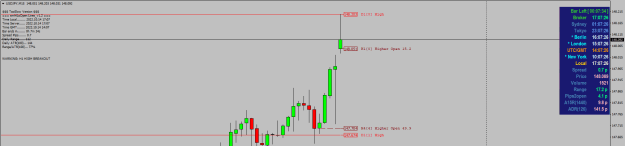
- lbtrader replied Oct 19, 2022
You followed the rule on this one, and you would have been stopped out at +5 anyway since price did not go beyond 9 pips, however you should notice that 2 hours later there was a higher H1 open which changed the entry line but the high was still the ...
Highest Open / Lowest Open Trade
- lbtrader replied Oct 18, 2022
You're on the way, your last two trades are by the rules, well done. As you can see, if you follow the +5 pip rule you tend to leave a lot on the table as in the second trade so what you can do is use a trailing stop as suggested by TS in the first ...
Highest Open / Lowest Open Trade
- lbtrader replied Oct 17, 2022
Hi Andy on your second trade you had two opportunities to sell and the first would have been a BE+1 and the second +5, but instead you sustained a -22 full SL. I suppose the rule to move your SL when you're in the green by increment of 5 is to ...
Highest Open / Lowest Open Trade
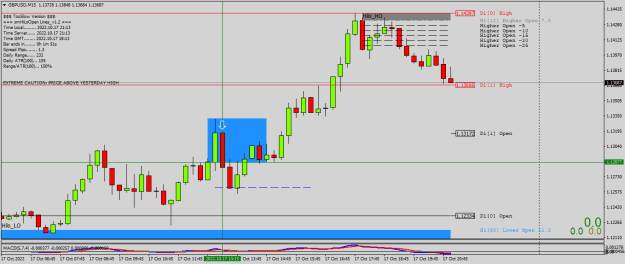
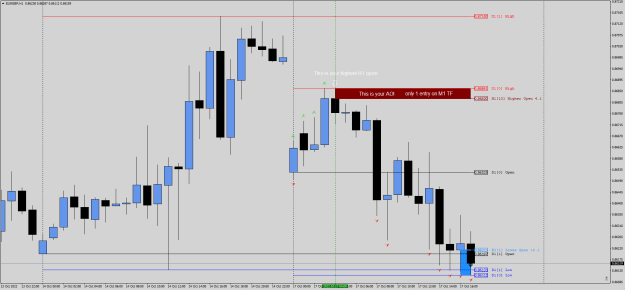
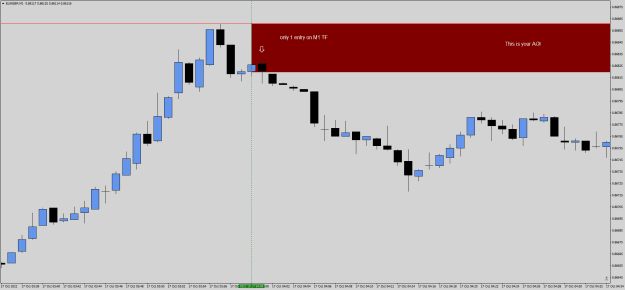
- lbtrader replied Oct 17, 2022
Hello den I presume the black candle is a bear candle right? in this case your highest open line is on the top of the candle and not the bottom. image image only one valid entry presented itself here on the M1 TF. Please refer to the pdf files ...
Highest Open / Lowest Open Trade
- lbtrader replied Oct 14, 2022
As long as the AOI did not change any candle that opens there is a valid candle and you can enter as many times as you find. Here are 5 entries on the same line. image
Highest Open / Lowest Open Trade
- lbtrader replied Oct 13, 2022
image and here you get 2 more entries image
Highest Open / Lowest Open Trade
- lbtrader replied Oct 13, 2022
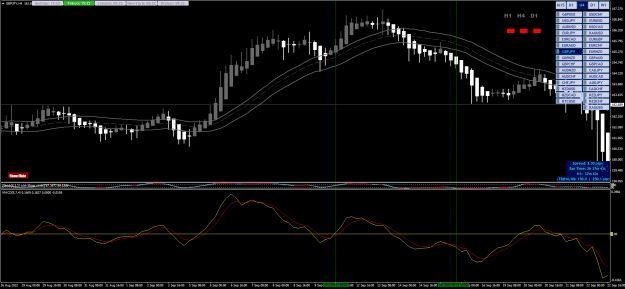
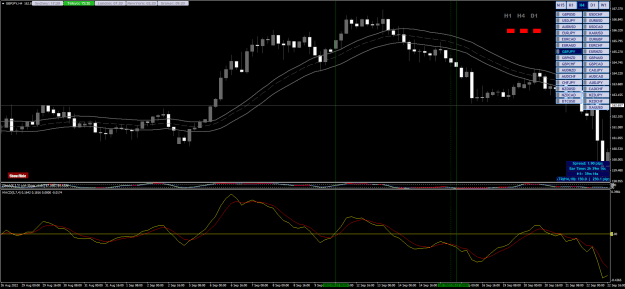
Hi Jpntrader, I tried to emulate your very neat and organized chart as much as mt4 will allow, you are absolutely right with regard to having both HA and classic candlestick charts side by side coz the HA does not tell you the Open/ close ...
The Small Turtle System (Donchian Trend +MACD)
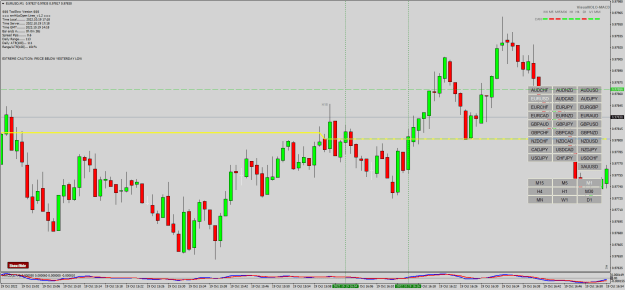
- lbtrader replied Oct 12, 2022
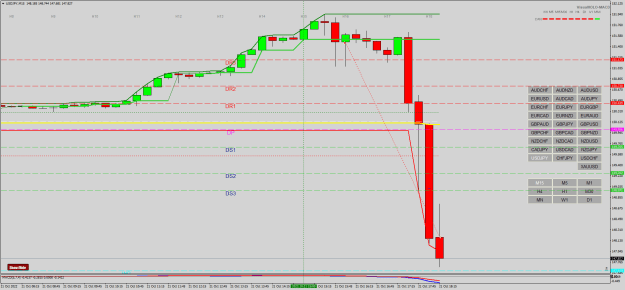
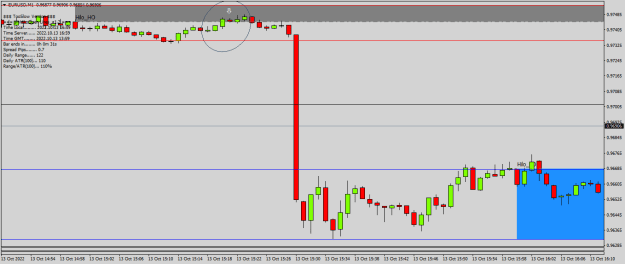
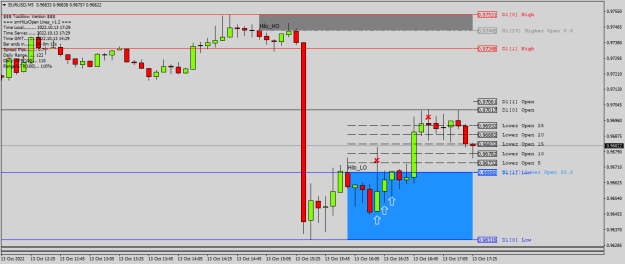
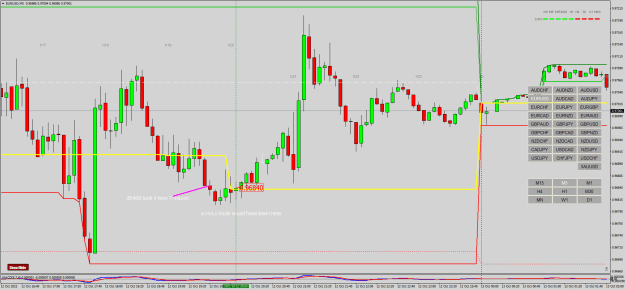
Hello Muni and d5400 image an hour ago yes, the lowest H1 was @ 0.9690, but @ the vertical line you can see that there is a lower H1 @ 0.9694 so technically (by coincidence
Highest Open / Lowest Open Trade ) the trade was taken at the right level, however it was not taken by ...
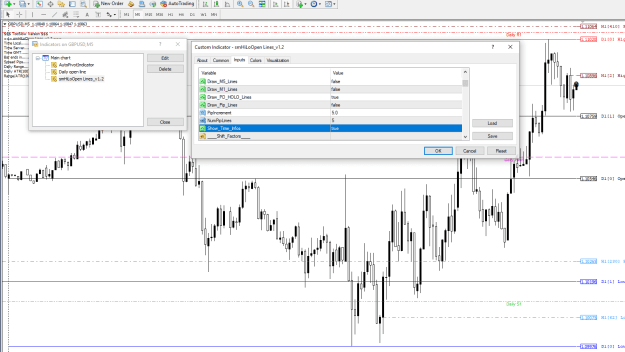
- lbtrader replied Oct 11, 2022
Sorry, but since you quoted my picture I will answer you. Please make sure the time infos in your indicator is true and the information you need will appear. image
Highest Open / Lowest Open Trade