- Search Crypto Craft
- 28 Results
- koainnn replied Feb 29, 2016
meanwhile i am more bearish than most experts.. i have eu at 0.8xxx and 0.77.. 0.77 is a reason i want to see 1.222, norm hit. or at least a fail at 1.170x so gator?? i can see how u got 0.8000 level and 1.222...how much effort did u put in to ur ...
EURUSD
- koainnn replied Feb 25, 2016
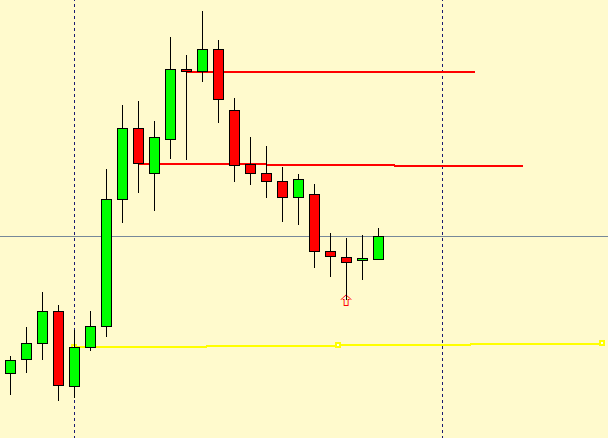
i better finish my last post about inside candles before im suspended again lol if ur short this yellow line is ur target.....this thing of ours sometimes doesnt work out and ill get u wacked LOL video
EURUSD
- koainnn replied Feb 25, 2016
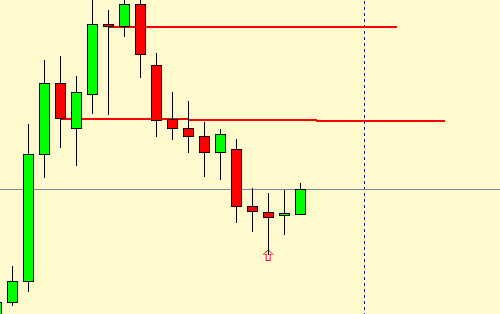
awhile back before i kept getting suspended by the 2 caped crusaders i mentioned low volume inside candles...i use volume for signals but i guess many people dont. alas it doesnt matter cause inside candles pretty much always provide a retracement ...
EURUSD
- koainnn replied Feb 3, 2016
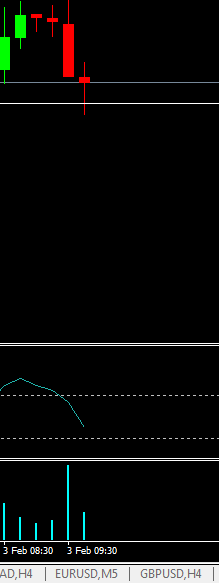
conners this a current example on cnh corse stoploss and money management is tantamount lol but inside low volume candles like this is what im talkin about
EURUSD
- koainnn replied Oct 17, 2015
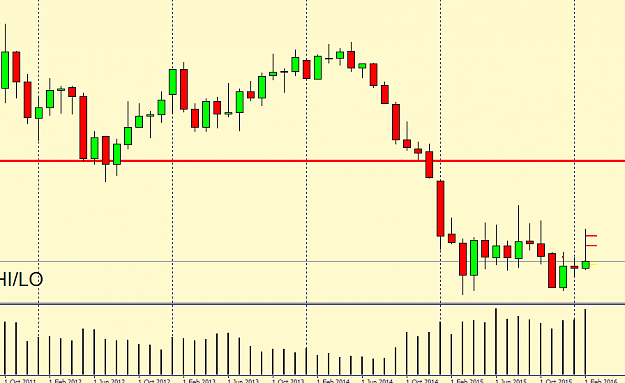
who is it that keeps ringing the china death knell?...from this chart it looks like they may have to rate cut again to keep the yuan from appreciating against the dollah....doesnt seem to many peeps worried china is on its last leg....merika sure ...
EURUSD
- koainnn replied Oct 1, 2015
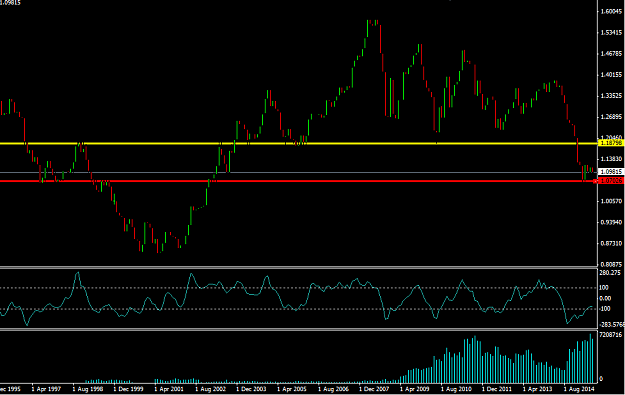
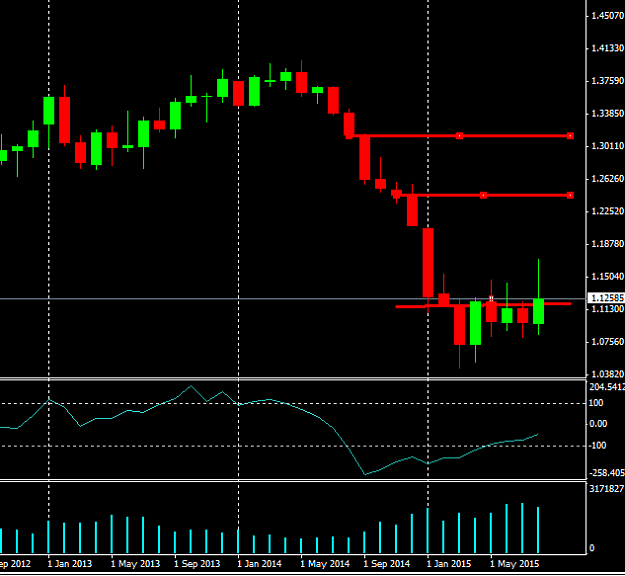
well the quarterly didnt close above the hi but did close above the open so ill prolly close my longs at last quarters hi....looks like we'll retest the lows at 1.0300...i think it will hold and be anutter long buy point cause unless a comet hits ...
EURUSD
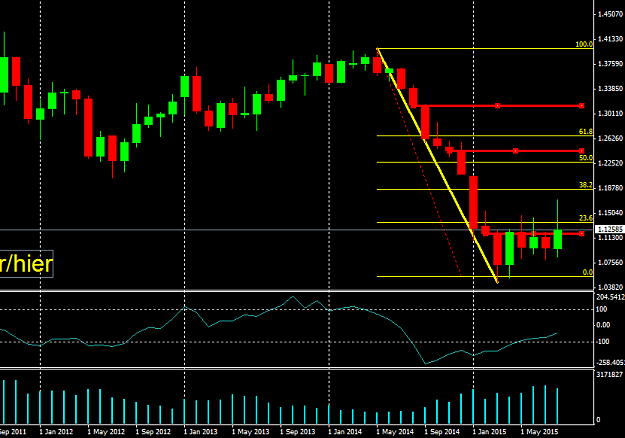
- koainnn replied Sep 18, 2015
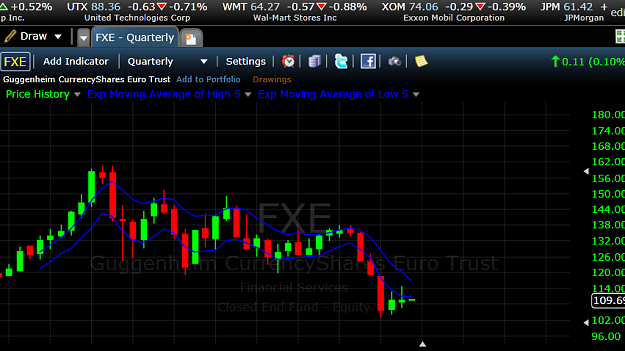
those r the monthlys and the quarterly...those r the only ones i still have so if u want to see all the charts i used to argue a trendchange ull have to go back in the chat
EURUSD


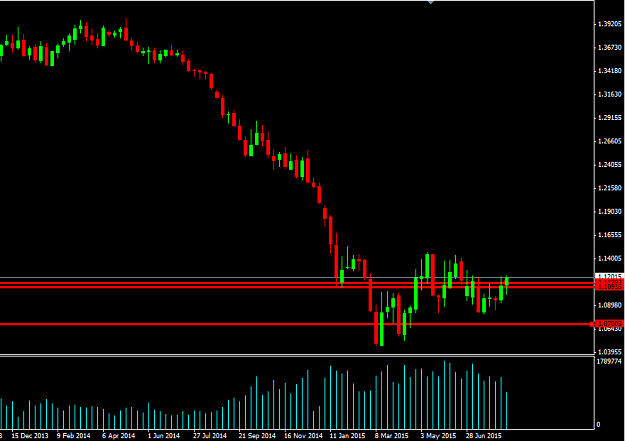
- koainnn replied Aug 28, 2015
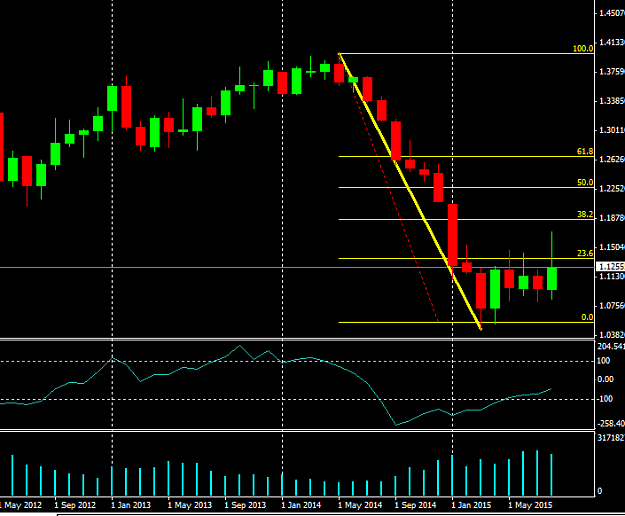
this is the monthly....a waterfall drop like that on a 1 hour or 4H chart will bounce to atleast 50% whether its a dead cat or not. i dont use indicators or pivots or fibo or any of the other labor intensive ways people try to predict prices but i ...
EURUSD
- koainnn replied Aug 27, 2015
if we be break under to the third line ill give up my bull case lol its do or die
EURUSD
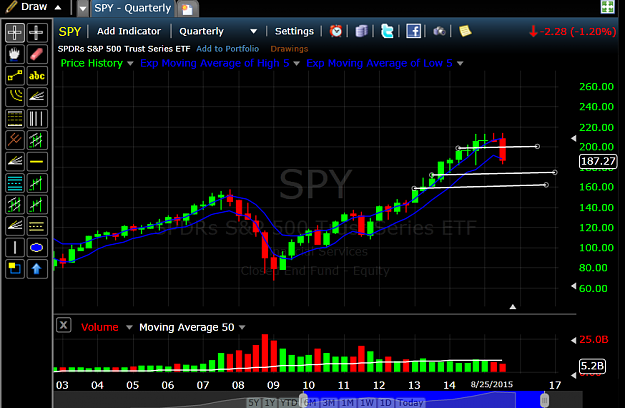
- koainnn replied Aug 26, 2015
i was talking about the eu our stock market dont look to good...my spy quarterly chart with my simple lower volume candle targets look like its going much lower....if it breaks and closes below that last trendline a drop to 120 is possible...if that ...
EURUSD
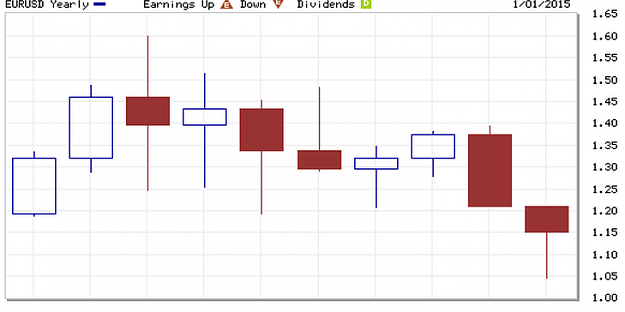
- koainnn replied Aug 26, 2015
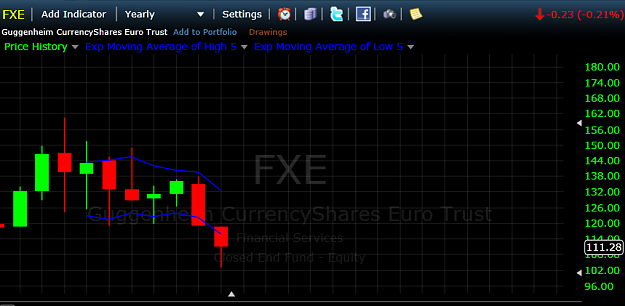
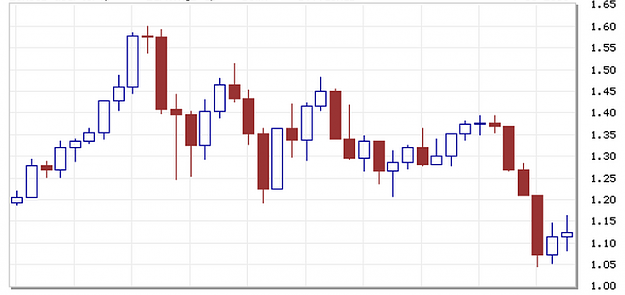
i even got more bad news for the bears....this is the yearly...and if price closes the year into the body of the preceding candle i dont think the whirl will end or europe self destruct and definitely a comet will have to hit the earth for parity to ...
EURUSD
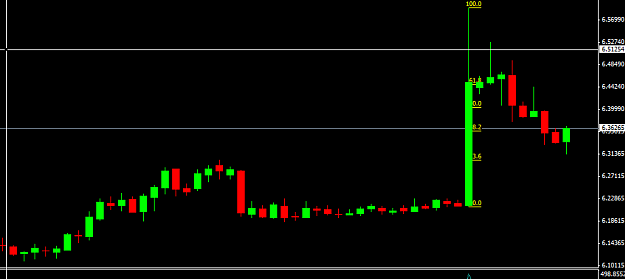
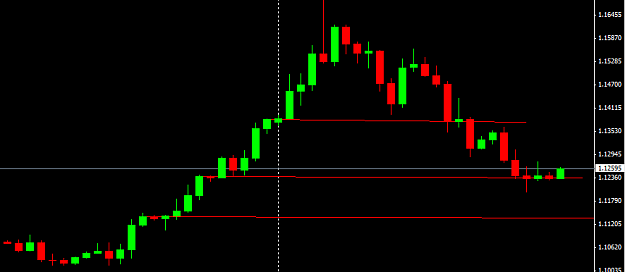
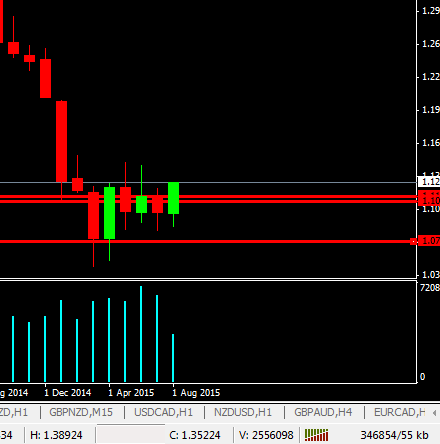
- koainnn replied Aug 25, 2015
this is the quarterly chart....a test of the open of the last red candle is probable...and on this glacial timeframe 1.3000 is dooable cause the slide was a result of news more than anything else and news events retrace 90% of the time
EURUSD
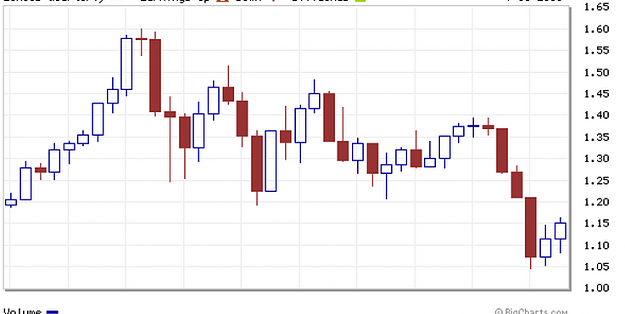
- koainnn replied Aug 20, 2015
us bools got our work cut out this last week and a day on the monthly....volume is pretty paltry compared to preceding month so expect lot of volitility as both sides clash to pick up volume....bears cant afford a monthly buy signal
EURUSD
- koainnn replied Aug 20, 2015
this is the weekly...what would people be doing if that was a hourly or 4H chart after such a waterfill spill downward? i know id be looking for a 50% bounce
EURUSD
- koainnn replied Aug 20, 2015
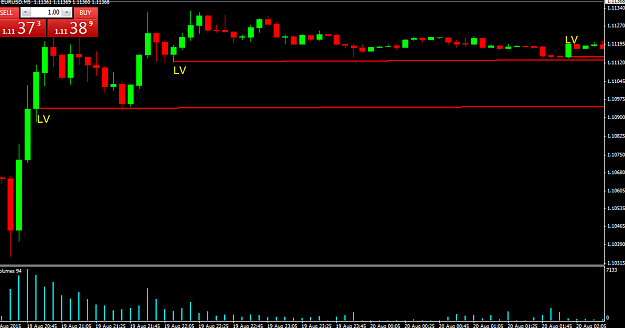
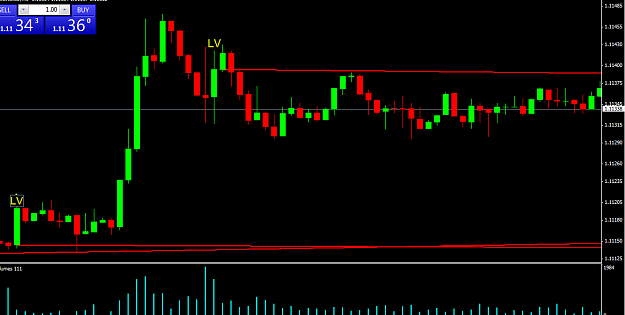
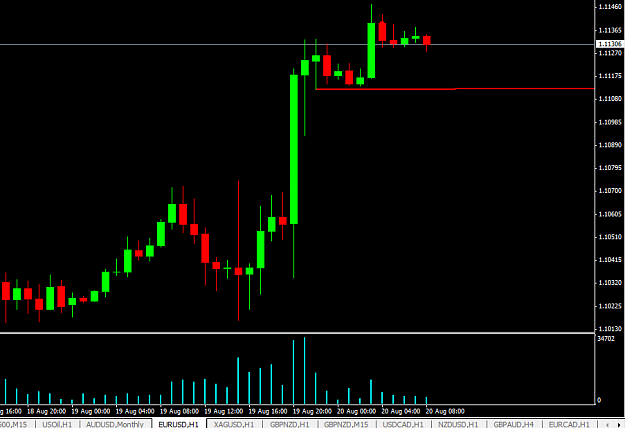
ive gotten some pm's asking to explain the "dummys guide for targets" LOL im gona use the 5 min. e/u chart from the fed leak today as u can see in the first chart i marked the UP green candles in a uptrend that were LV...price retraced to the ...
EURUSD