- Search Crypto Craft
- 37 Results
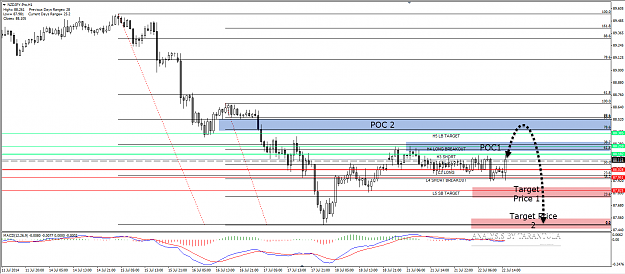
- kaunasny replied Jul 23, 2014
Yes, I see POC here that starts at about 88.21 at best. You have a green line at 88.182 On my data prise rose to 88.165 , but I guess somehow you was able to enter short, also without a limit order. Of course you don't show this anywhere live. ...
Spider's Den
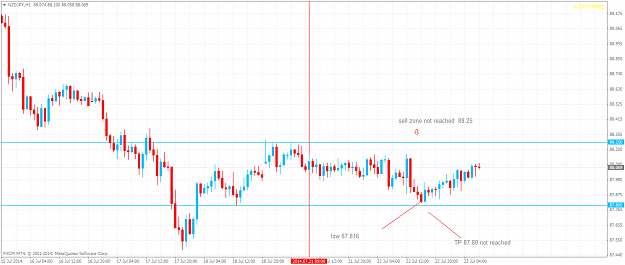
- kaunasny replied Jul 23, 2014
Hey Tarantula, First day looking at your thread, my friend recommended your thread, so decided to take a look. I'm confused a little bit about your results here. This is what I see. Entry zone 88.25 was not reached on my data, even thought let say ...
Spider's Den
- kaunasny replied Mar 15, 2013
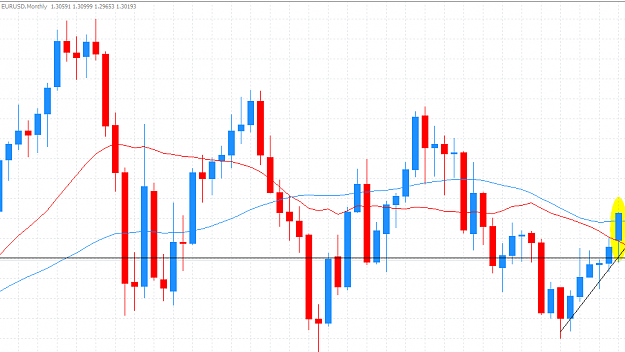
I look at volume as the size of the movement on the graph, other words the ATR. Since that Big Boss hammer or we can call that the start of the 2012 the monthly movement decreased greatly that's all I wanted to say, not that this view has any impact ...
Strat's Long Term Stress Free Trading
- kaunasny replied Mar 15, 2013
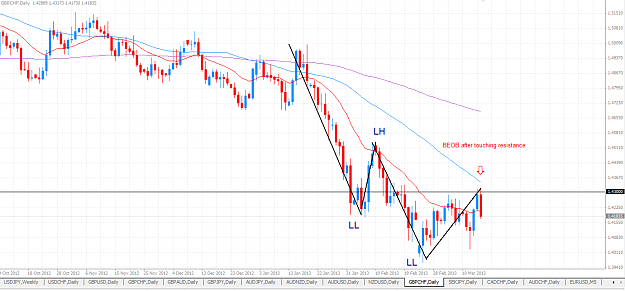
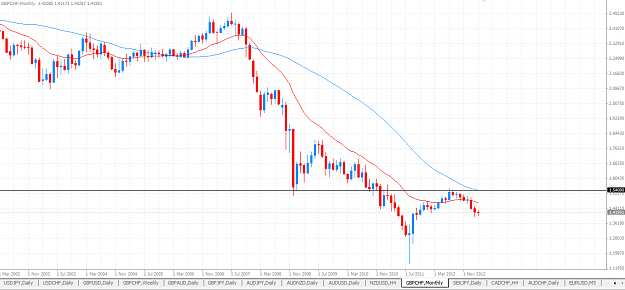
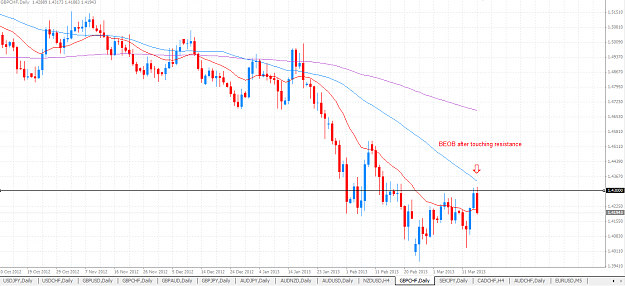
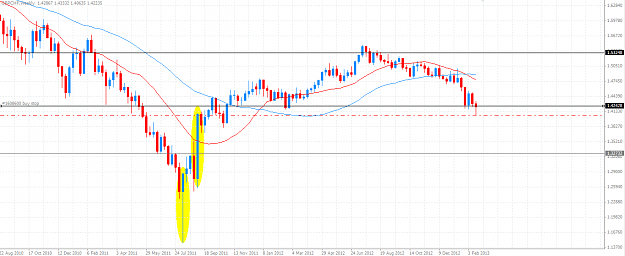
GBPCHF BigBoss - Formed support at beginning of 2009 and broke through it at the end of 2010. At 2011.08 Big Boss formed huge hammer after all this downtrend which lasted 4 years. Did the hammer PA work? Yes it did. It pushed prices up but only to ...
Strat's Long Term Stress Free Trading
- kaunasny replied Mar 13, 2013
Yes, it looks good now once we broke support of that horrible 1.300 . But weren't we suppose to wait for break of that 1.300 and entering in front of this support was a suicide? I have actually turned to H4 and was waiting for a signal there. I was ...
Strat's Long Term Stress Free Trading
- kaunasny replied Mar 13, 2013
Yes definitely Worker and Boss are still up. But those 3 weeks strong down movement is telling me something is up at this level and that there might be a down swing forming. Entering with nice PA at this level cautiously for a possible down swing. ...
Strat's Long Term Stress Free Trading
- kaunasny replied Mar 12, 2013
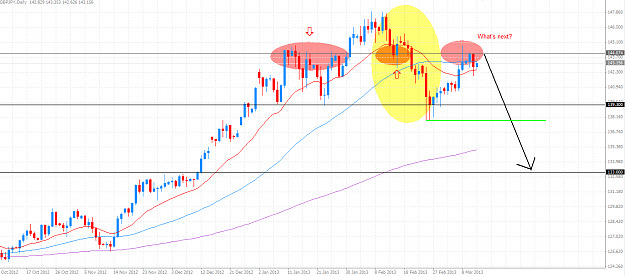
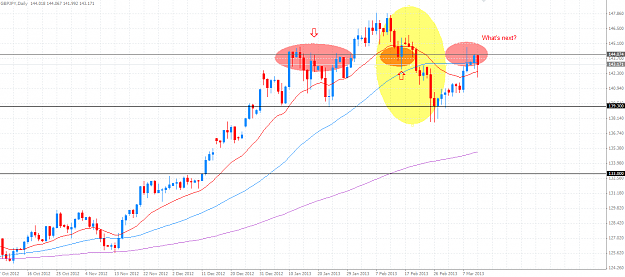
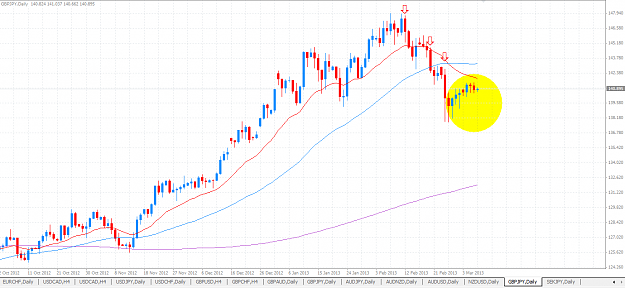
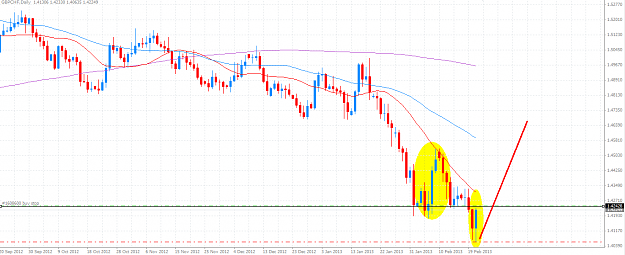
There was some talk about GBPJPY so I'll give it my view. Currently we have interesting position forming. Jan 10th to Feb 1 price was rejected by resistance at 144.00. That was 20 day rejection finally breaking through. Price has found support at ...
Strat's Long Term Stress Free Trading
- kaunasny replied Mar 7, 2013
Hello TheInformant, Nice thread you have here. And the video explanations are awesome thing you make here. Looking forward to this. Now I know it's easy to tell wrong once it has already happened, but look at my view why I think it wasn't the best ...
The March to Success
- kaunasny replied Mar 7, 2013
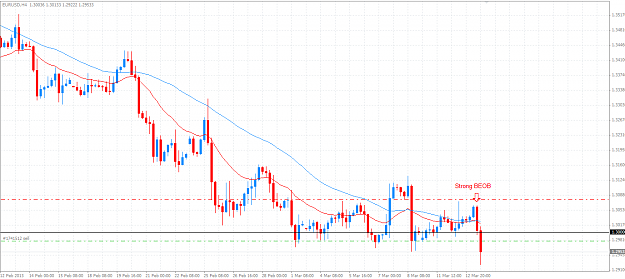
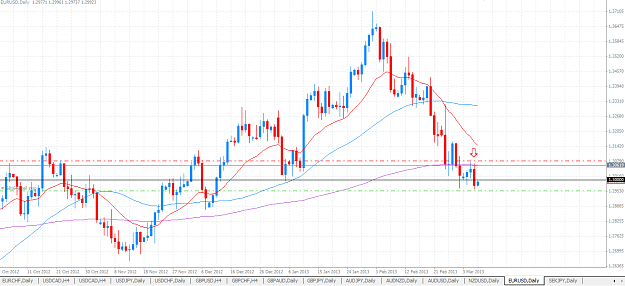
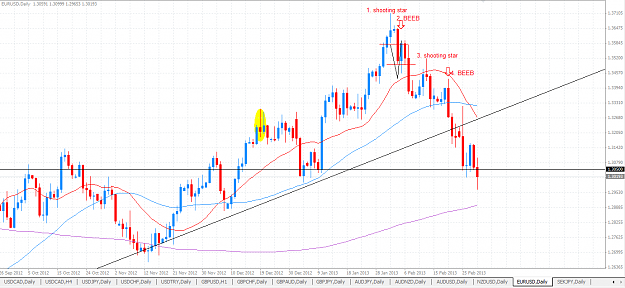
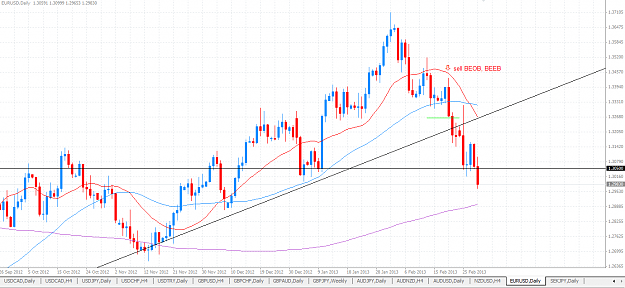
EURUSD Another pair to look at. We have another BEEB on a chart. Do we sell or is too low? Price has created a weak resistance at 1.3060. Recently seems having some level for the price. Maybe 200 MA helping? At the entry we will be below strong ...
Strat's Long Term Stress Free Trading
- kaunasny replied Mar 7, 2013
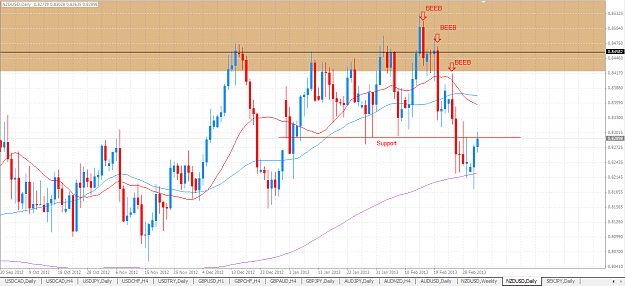
And here we have what I was waiting for. Even thought that BEEB is not that clearly defined. Meaning it closed only few pips below last bars open, but what makes it stronger is the whick going inside the Strat shadow. That's a strong PA for me. ...
Strat's Long Term Stress Free Trading
- kaunasny replied Mar 7, 2013
Hmm.. All I can see is the small / weak bars for the past 7-8 days. This tells me there are no buyers. Maybe only sellers taking profit after pushing market down from top of Feb 11th. I believe we will have another wave of sellers sometime soon. ...
Strat's Long Term Stress Free Trading
- kaunasny replied Mar 5, 2013
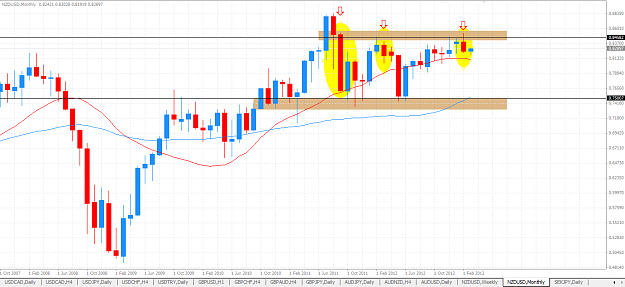
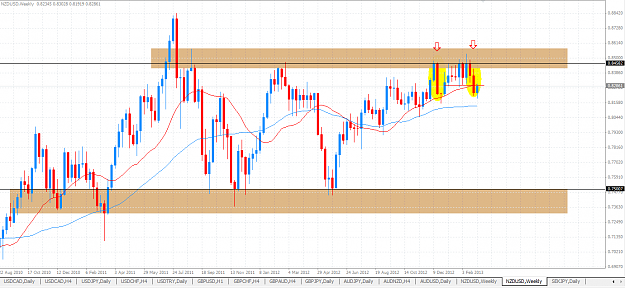
Hi, I'm no Kiwi expert and my view probably is the least you're waiting for but since it's opposing yours I will give it ago. Also I believe its real PASR which this thread is about. Now I'm actually waiting for PA to go short this pair as I believe ...
Strat's Long Term Stress Free Trading
- kaunasny replied Mar 2, 2013
Sorry to be bothersome, but if you don't mind I have few more comments on our conversation. Could you please tell your opinion on when did BOSS started to tell us to start selling. I will post the chart again. Was it week starting 2013.02.10 after ...
Strat's Long Term Stress Free Trading
- kaunasny replied Mar 2, 2013
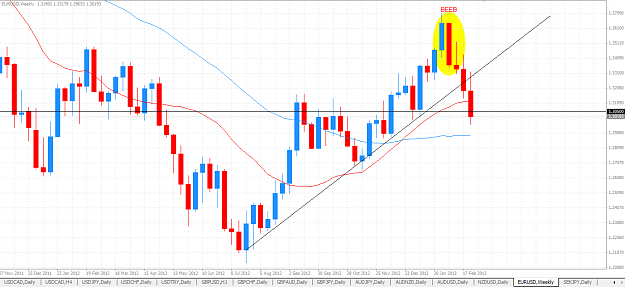
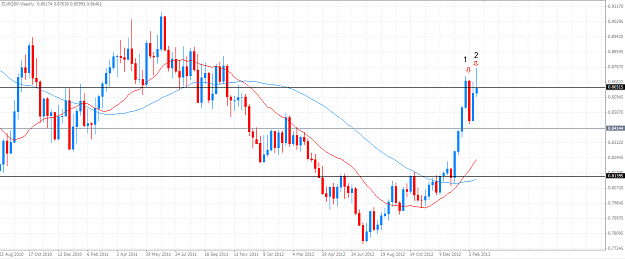
To be a seller before March 1, 2013 of EUR/USD Big Boss is telling me this - Look below at chart image Do we want to trade against 6 months of strong uptrend? Beginning March 1, we have strong bearish bar and that is BEEB telling us to look for ...
Strat's Long Term Stress Free Trading
- kaunasny replied Mar 1, 2013
Hello Strat, Could you please break my confusion. I thought we could not trade or especially sell EURUSD pair because of BOSS not letting us do so. On the BOSS I see. Strong support 1.3050 which price has not yet closed below it on the BOSS. We're ...
Strat's Long Term Stress Free Trading
- kaunasny replied Feb 21, 2013
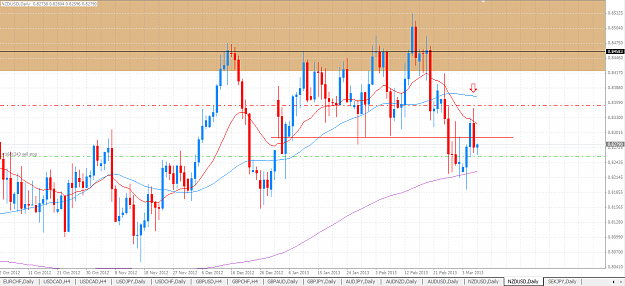
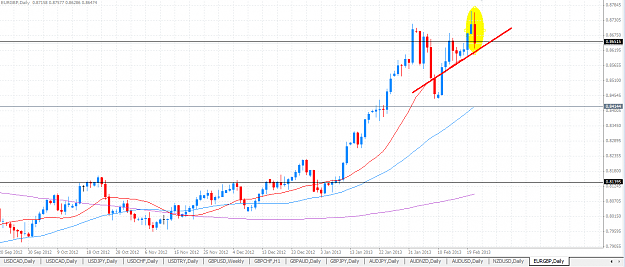
EUR/GBP Another PA to look at. This is counter trend situation that looks interesting. On Boss we had a trend change to the upside. With 4 strong weekly candles taking prices to the sky or untill prices stalled at resistance line of 0.8700 on Feb. ...
Strat's Long Term Stress Free Trading
- kaunasny replied Feb 21, 2013
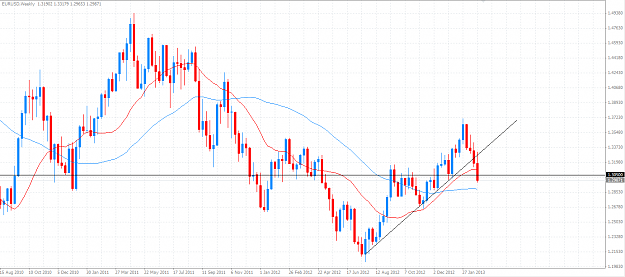
In my view in no way I want to sell this. I'm looking to go long this pair. On weekly (BOSS) - Week starting 2011.08.07 we had a huge hammer bar with strong close sending prices 2600 pips. The BOSS bar starting september 4th also helped to ...
Strat's Long Term Stress Free Trading
- kaunasny replied Feb 20, 2013
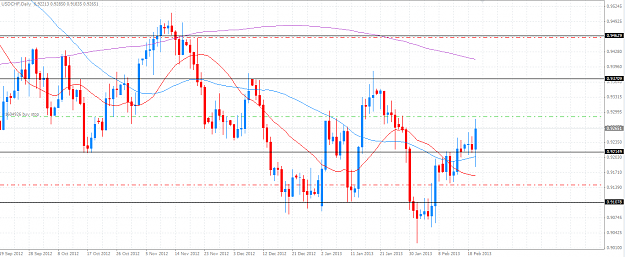
Another position to trade. USD/CHF Price in a weekly range. Therefore I'm looking for trades from bottom range to top range. We have hit the bottom of the range Feb 01 giving us a nice hammer signaling longs. Startng February we have buyers in ...
Strat's Long Term Stress Free Trading
- kaunasny replied Feb 20, 2013
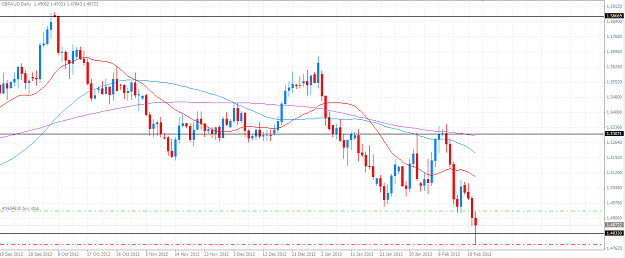
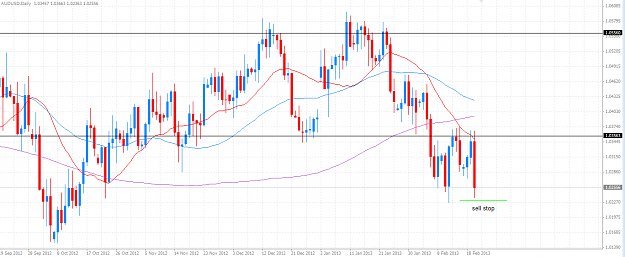
Strat wants to warn us that Feb 20th Daily candle giving us a sell signal with this strong bearish bar is right at strong BOSS support? And therefore in no way should we be taking short positions here just yet. AUDUSD image
Strat's Long Term Stress Free Trading
- kaunasny replied Feb 20, 2013
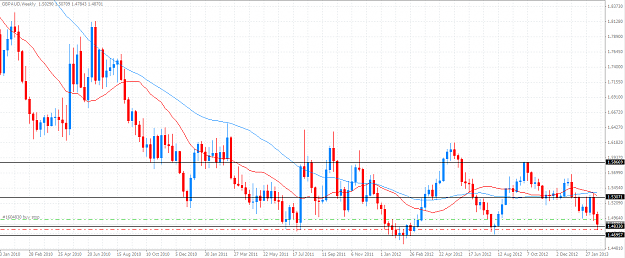
I will try to post one trade here after "vacation"
Strat's Long Term Stress Free Trading go easy on me. I believe this trade if at all tradeable would go to high risk trades section. Trading GPB/AUD. On weekly: We have a big range 1.6100 - 1.4700 That would be 1400 pip range. We are ...