- Search Crypto Craft
- 46 Results
-
 kaboemm replied May 24, 2016
Thanks for your reply Numbuts, it's really helpful. I thought they moved in about the same direction
Advanced TST The reason I was a bit disappoint I can't trade the grains is that for me fundamental wise it's way easier to read a COT report then go out on ...
- kaboemm replied May 23, 2016
Great to hear that I'm on the right track! Motivates me
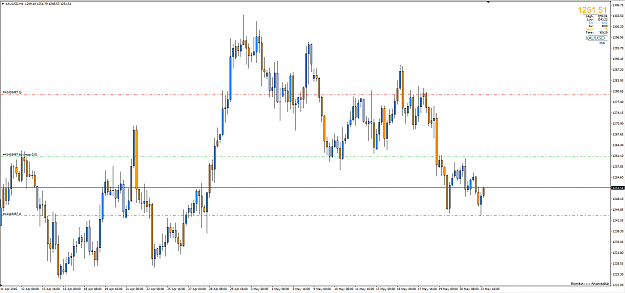
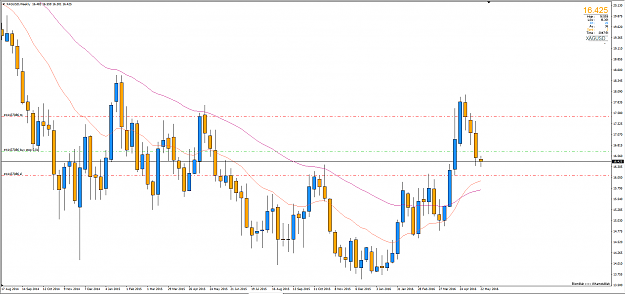
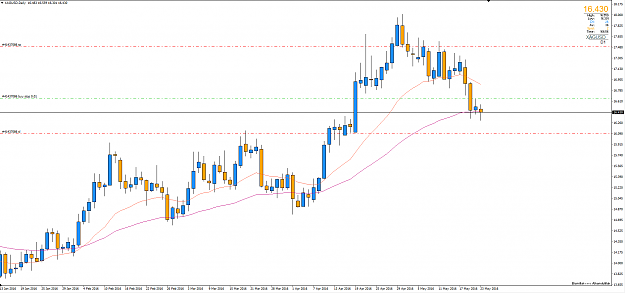
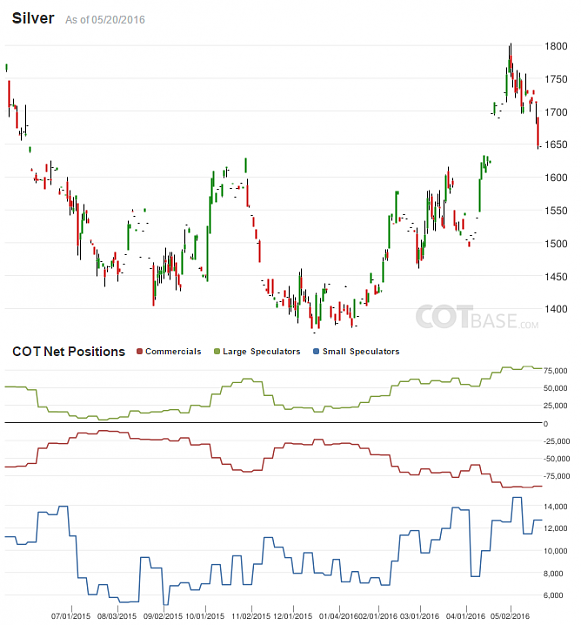
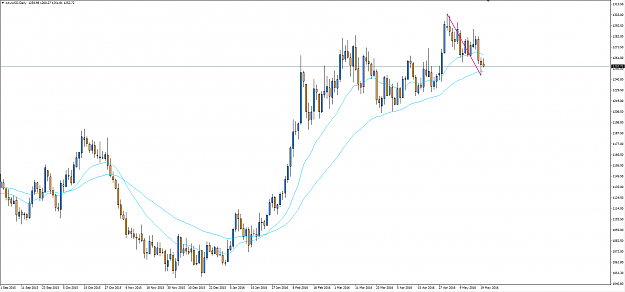
Advanced TST My orders on XAUUSD are still standing. image Also, I do have about the same orders on Silver and Platnium. XAGUSD - Weekly image COT image XAGUSD - Daily Nice pullback to the 50 EMA ...
- kaboemm replied May 20, 2016
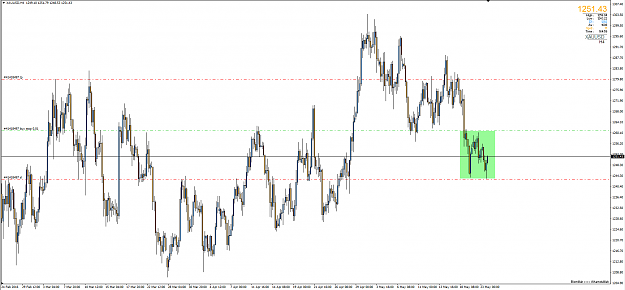
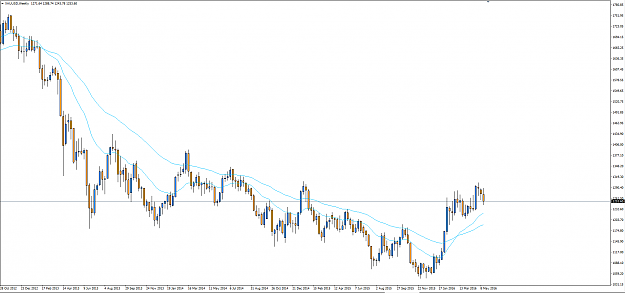
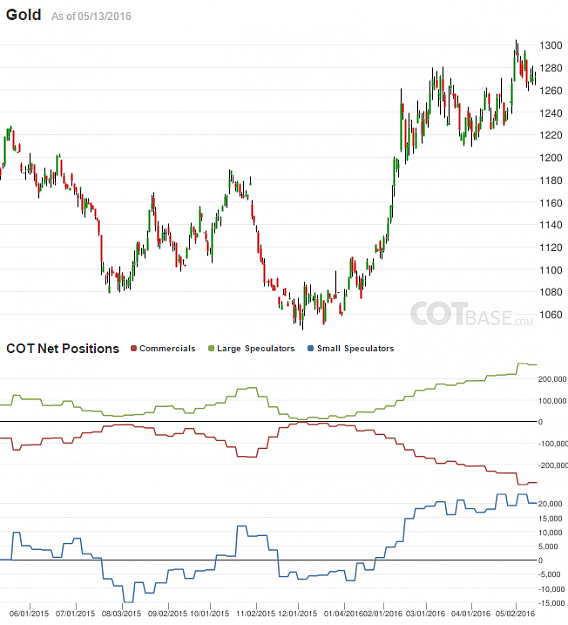
Hey Numbnuts, Is this a valid analysis in your opinion? Gold XAUUSD - Weekly We're in a rather young bullish trend right now. 50 and 20 MA's supporting that. Strong bullish LBC. image Large speculators still long on the COT reports. image GOLD ...
Advanced TST
- kaboemm replied May 19, 2016
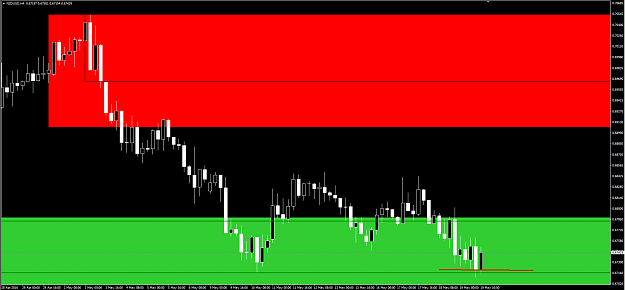
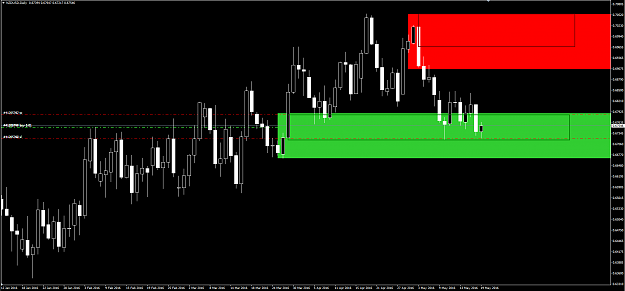
Ok I get it. Thanks for the explanation. So first off I learned (again) that Unemployment claims and FOMC cant put a lot of volatility in price. An update on my DEMO trades: NZDUSD - 4 Hour image I had my SL on that big red horizontal line under ...
(binned per thread starter’s request) Truth in Trading
- kaboemm replied May 19, 2016
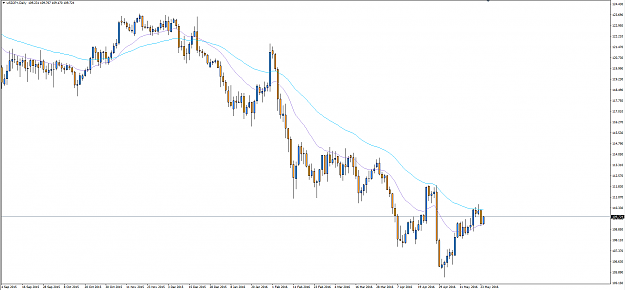
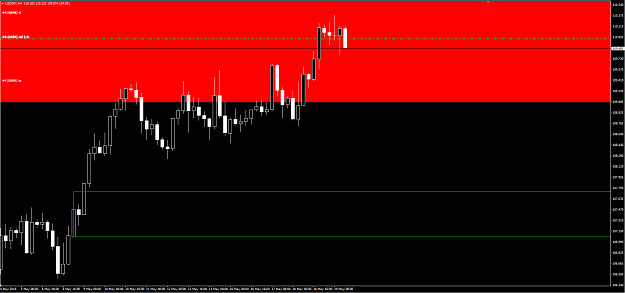
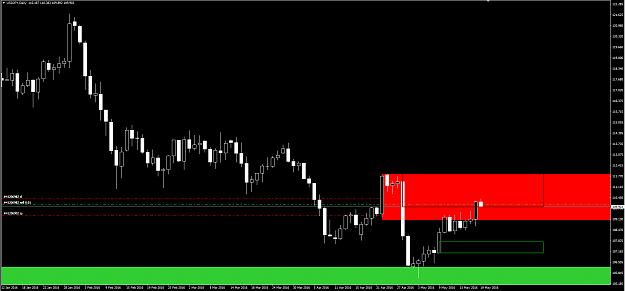
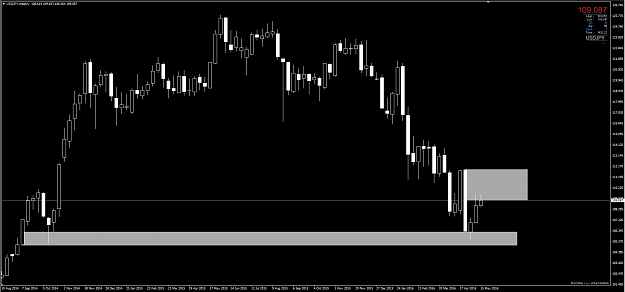
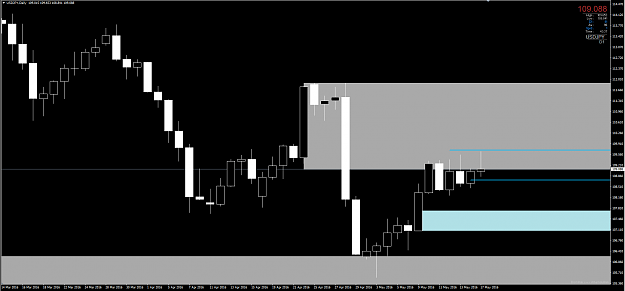
I got a second DEMO short trade on USDJPY. USDJPY - Daily image Price is in a weekly + daily resistance area. USDJPY - 4 Hour image Price made two spinning tops and after a high wave candle which translates into indesiscion. After this candle we ...
(binned per thread starter’s request) Truth in Trading
- kaboemm replied May 19, 2016
Ah I see yes. You could not have gotten a better entry
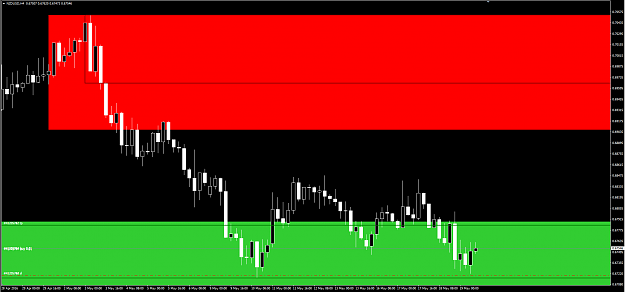
(binned per thread starter’s request) Truth in Trading I got myself in a NZDUSD long DEMO trade. NZDUSD - Daily image As you can see on the daily chart price is in a weekly + daily support. NZDUSD - 4 Hour image Manually opened 3 long ...
- kaboemm replied May 19, 2016
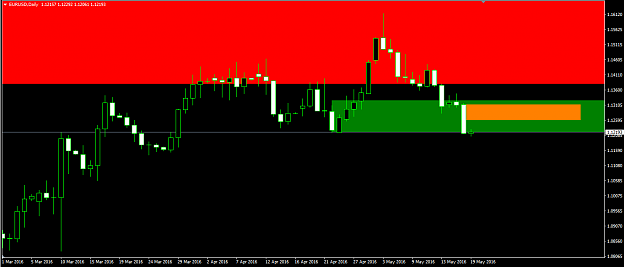
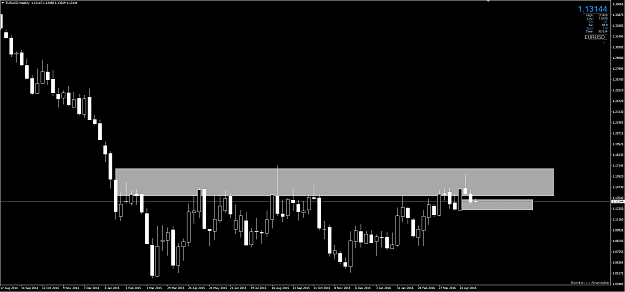
Great catch! May I ask what exactly caused you pull the trigger? Winston, do you also take these daily candles in consideration on the H4 chart giving the fact that they might counter the weekly LBC? For instance on EURUSD we have price in the ...
(binned per thread starter’s request) Truth in Trading
- kaboemm replied May 17, 2016
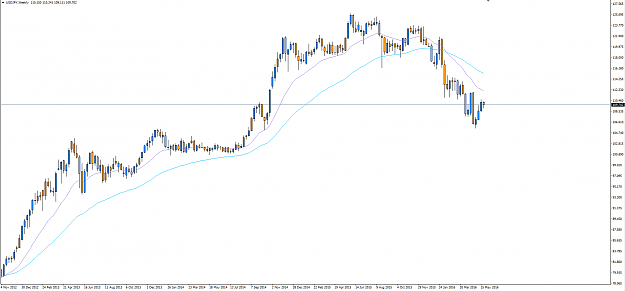
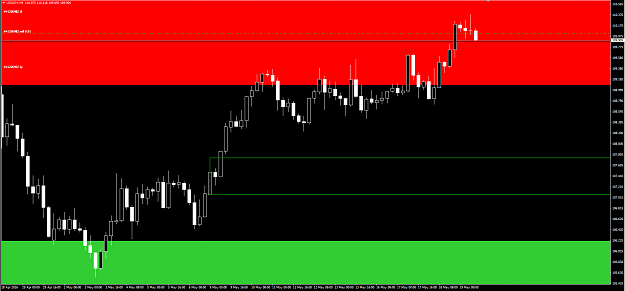
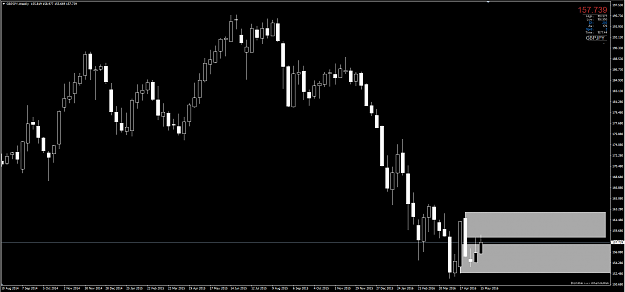
So my daily candles will close in about an hour. I'm looking at USDJPY and was wondering if you would consider trading this (that is if the daily candle stays about the same). GBPJPY - Weekly image GBPJPY - Daily Now what I was wondering looking ...
(binned per thread starter’s request) Truth in Trading
- kaboemm replied May 17, 2016
Hey Winston, Thanks for letting me reply to this thread. I would like to know if I draw these areas of support and resistance correctly on my weekly charts. I know you're a busy guy so I'll just post 3 of them. EURUSD Weekly image GBPJPY Weekly (I ...
(binned per thread starter’s request) Truth in Trading
- kaboemm replied May 11, 2016
I'm also in this trade. I was hoping for it to bounce of the 200 and BRN 1.44. At the moment price is moving slow as London is closed. We'll see! I'll keep the updates coming^^
Lower risk, stress free TDI system
- kaboemm replied May 11, 2016
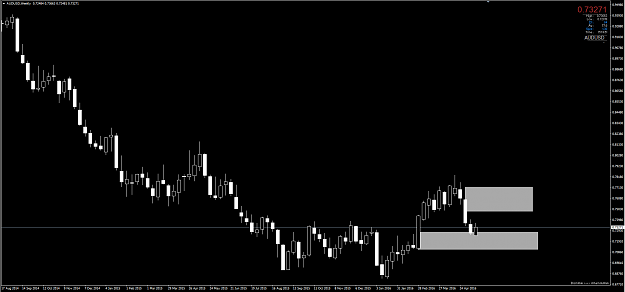
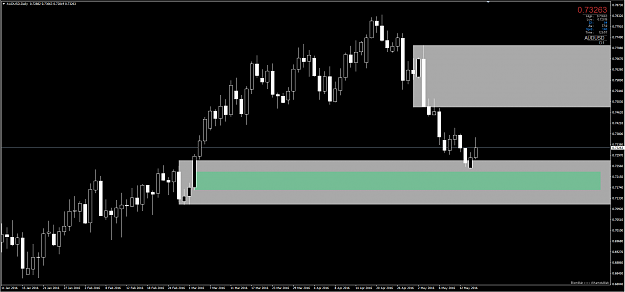
Seems like a good entry to me. Seems like price has a little trouble piercing through that BRN 0.74 though. If the prices pierces through, I would at least keep an eye on the 200 EMA daily chart, it'll be heading for it. image Also, you're trading ...
Lower risk, stress free TDI system
- kaboemm replied May 11, 2016
I like quizes!
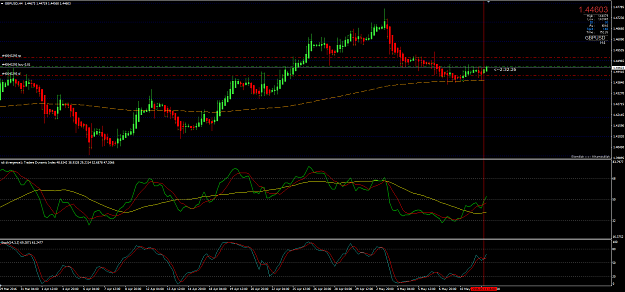
Lower risk, stress free TDI system Personally I would pass this trade (I actually did because I was watching this one aswell). Not Because it isn't a good setup, because it's a decent setup, TDI and stoch wise. But the bar compared to the previous ones is small. ...
- kaboemm replied May 11, 2016
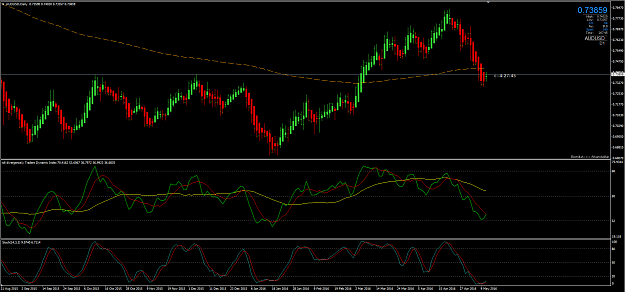
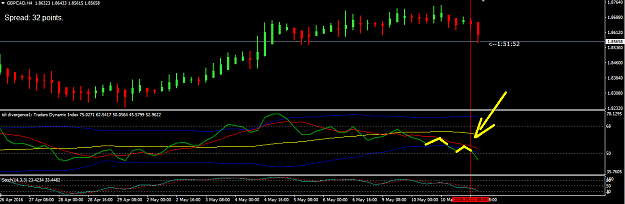
Ill get what you're trying to say. It is not a ideal bounce, but it was, in my opinion, a good steady bounce to take. image I don't think the green line has to be at a 90 degree angle but I think bounce to where the yellow arrow is pointing is ...
Lower risk, stress free TDI system
- kaboemm replied May 11, 2016
Nice trade! Closed mine at +60 as it was 1:1 SL/TP ratio. Thinking about opening a second trade so I can close 1 if the 1:1 is hit and then move the second trade to BE+5 or so and let it play out for more pips. image
Lower risk, stress free TDI system
- kaboemm replied May 11, 2016
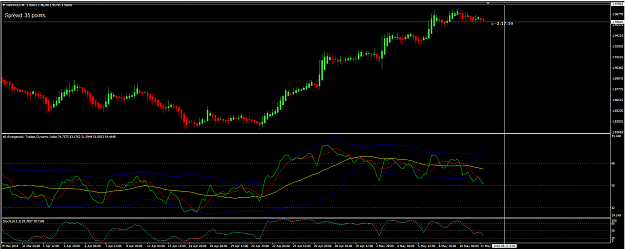
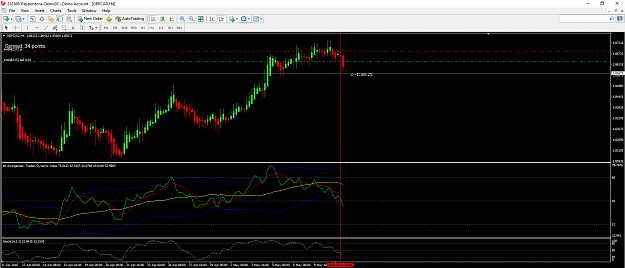
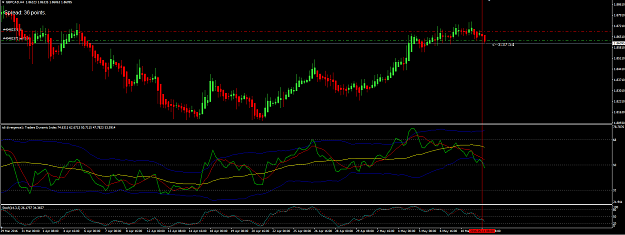
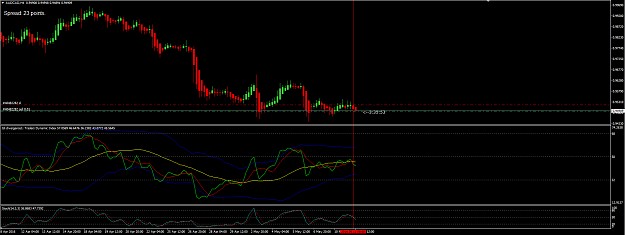
Ill took the same bounce entry on GBPCAD. image Also took AUDCAD, this one did cross the yellow TDI and the red at the same time. Don't think it's such a strong signal but we'll see. image
Lower risk, stress free TDI system
- kaboemm replied Apr 7, 2016
Taken out on +25 pips. image I've used the stop loss trailing strategy jmezz just explained a few posts before (thanks!). Moved the SL to the middle of the big bar, price also hit the 1:1 ratio.
Ratios & Harmonics: a Different Way to Trade
- kaboemm replied Apr 7, 2016
Good morning traders! Took that swing down earlier aswell and locked in about 15 pips there. Playing with real money for the first time. Might aswell up my lot size a bit as I'm playing with 0.01 sizes now and it doesnt really affect me making 2 ...
Ratios & Harmonics: a Different Way to Trade
- kaboemm replied Apr 6, 2016
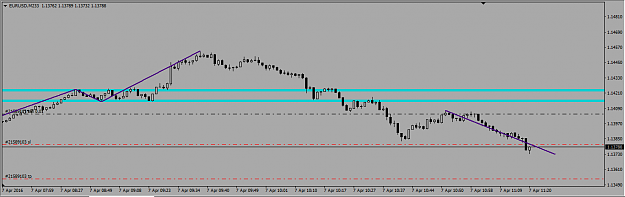
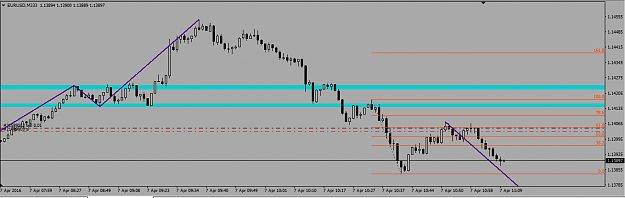
Short EURUSD, BE atm. Had a small SL of 5 pips, it almost got hit. Initial TP on 1:1 Projection but will trail accordingly. image EDIT: Moved SL to BE + 5 image
Ratios & Harmonics: a Different Way to Trade
- kaboemm replied Apr 6, 2016
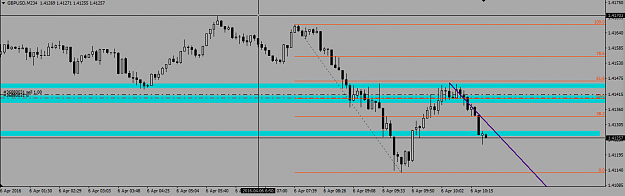
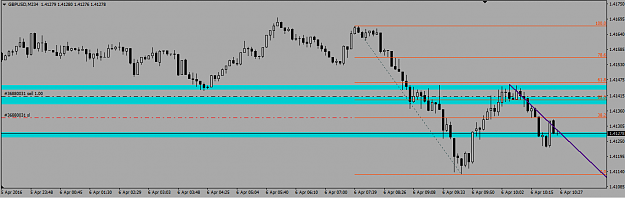
Goodmorning traders, Short cable 233 tick, atm at BE. image EDIT: BE + 8 at retrace. image EDIT2: Taken out at +8
Ratios & Harmonics: a Different Way to Trade
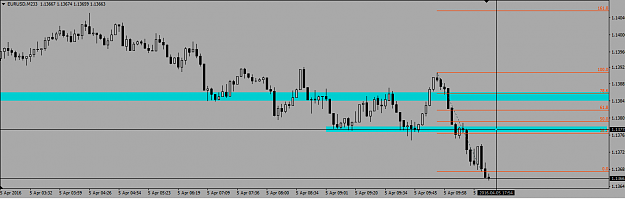
- kaboemm replied Apr 5, 2016
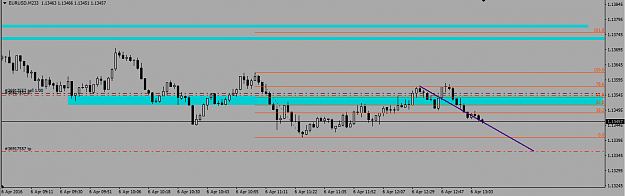
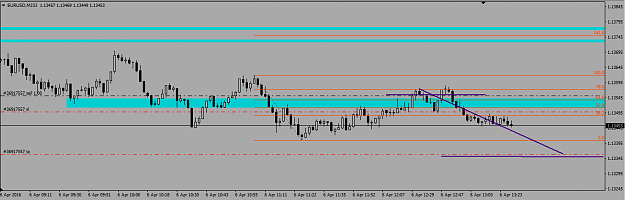
Nice 20 pips you made there. Great entry aswell. I'm looking for a retrace on EURUSD to get short around the 50% fib + structure. Thanks for the heads up on the news and have a great time on your travel! image EDIT: Looks like I missed that boat ...
Ratios & Harmonics: a Different Way to Trade