- Search Crypto Craft
- 76 Results
- joaoborras replied May 16, 2013
My comments about the "doomed test" was terrible! sorry for that! But, the spring worked out nicely!
vsa with Malcolm image IEB will have a nice sleep night!
- joaoborras replied May 16, 2013
It reached your target... but today only!
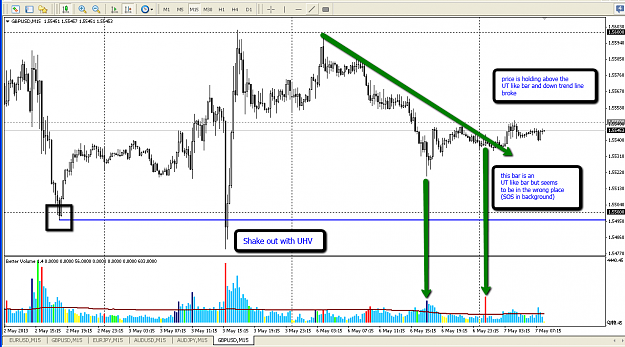
vsa with Malcolm And just commenting a bit on your trade, the short was valid for a scalp because as was pointed out, there is SOS in the background. Another case for your short would've the the UT the price made when ...
- joaoborras replied May 15, 2013
Cable is on drugs today!
vsa with Malcolm image It is what happens when central bank guys open their mouth....
- joaoborras replied May 13, 2013
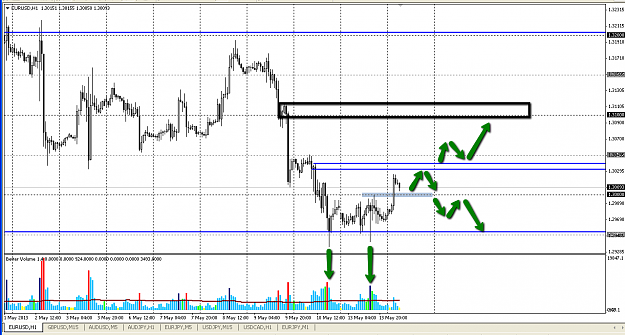
I agree with the weakness. Here is a 1hr chart: image We have a good supply area but, at the same time, some buying in the bottom. So, the key area is really 2950 to the down side. Now, EU is testing the highs of the last range(1.3000 again). I ...
vsa with Malcolm
- joaoborras replied May 13, 2013
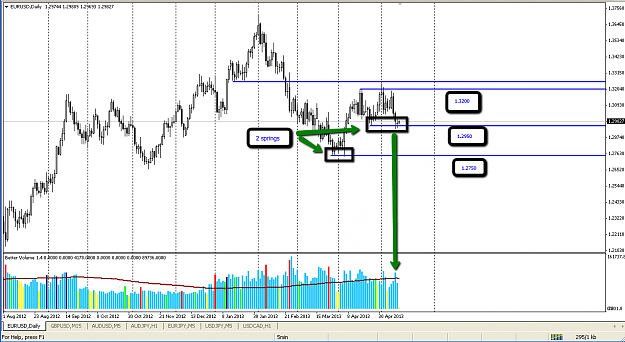
Here is a daily eurusd. It is a very well defined range, with 2 springs(the black boxes), what allows us to make a clear trading plan. If the pair keeps above 1.2950, then a rise up 3200 is in view. If not, a test of 2750(the 1st spring) is in place ...
vsa with Malcolm
- joaoborras replied May 10, 2013
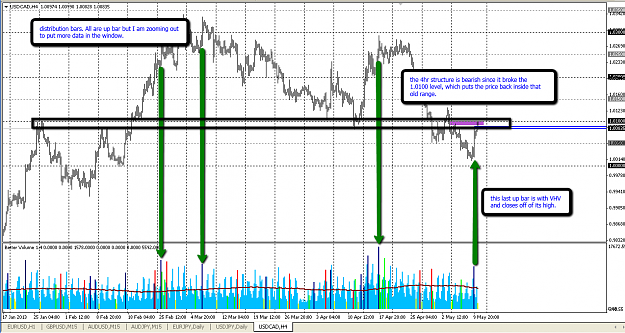
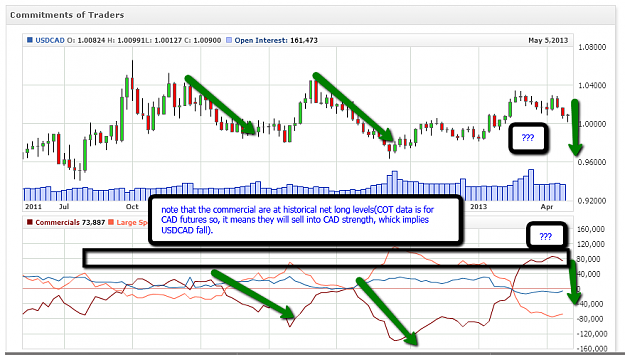
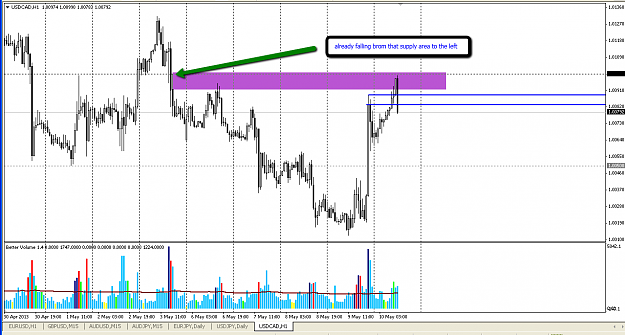
I am looking at UC. The 4hr chart shows a clear distribution area, as below: image The 1hr chart, she's already fallen from the supply level: image And the COT data also corroborates a fall in the pair: image Today we have CAD employment data, ...
vsa with Malcolm
- joaoborras replied May 8, 2013
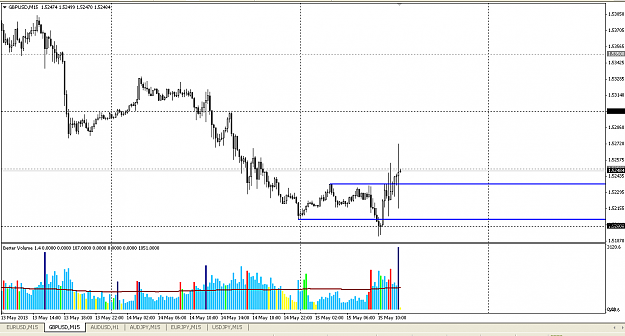
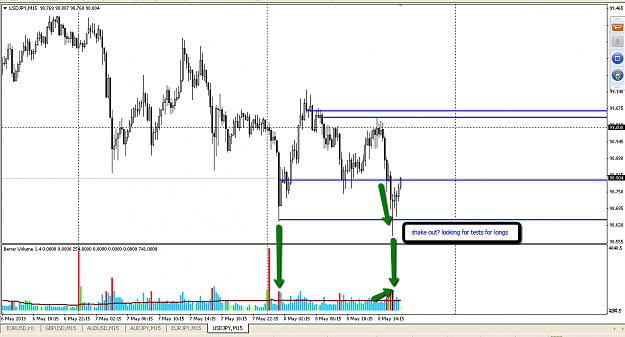
Shake out on UJ, on the 15min chart: image Let's see if it has more legs up.
vsa with Malcolm
- joaoborras replied May 8, 2013
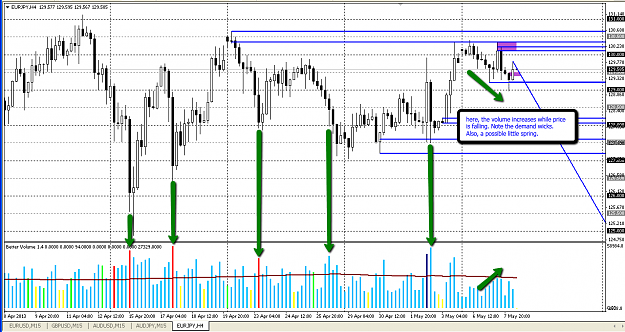
I also like EJ to the long side. here is a 4hr chart: image The blue lines make more sense in a 1hr chart, that is where they come from.
vsa with Malcolm
- joaoborras replied May 6, 2013
about the AJ move, I would like to add my 1cent on this one, using SD charts(infringing copy rights here! :-) It is also in hindsight but it is highly valuable to input it in our minds for next time we see it. Anyways, the point I would like to ...
vsa with Malcolm
- joaoborras replied May 1, 2013
A 4hr chart view for euro. image Please, feel free to comment, add or correct.
vsa with Malcolm
- joaoborras replied May 1, 2013
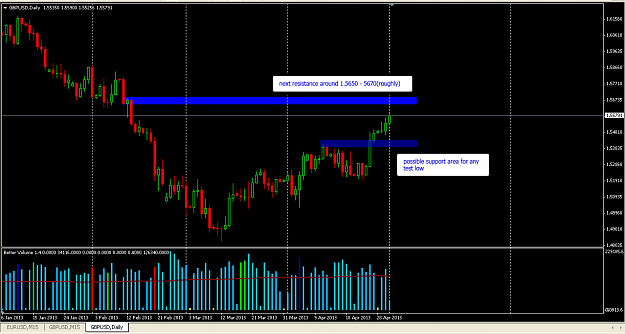
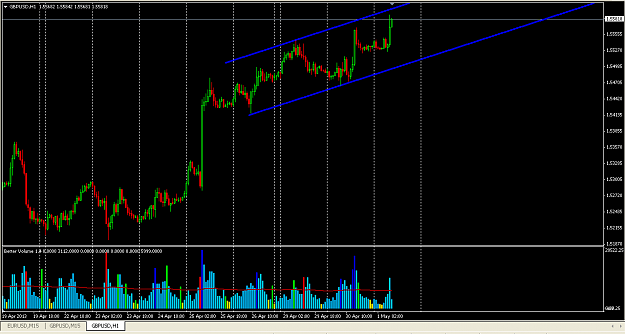
Cable 1hr, showing a very nice up trend, with an up channel and HHs and HLs. image Daily chart, we have some possible resistance above. image
vsa with Malcolm
- joaoborras replied May 1, 2013
It was interesting to see the price action in cable today. I was concerned about the long view but it was what it was. :-) image But today's trade is very thin so, instead of buyers stepped in, could be lack of sellers as well. Let's see how the ...
vsa with Malcolm
- joaoborras replied May 1, 2013
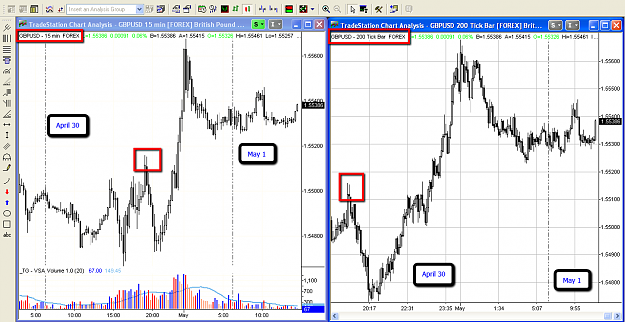
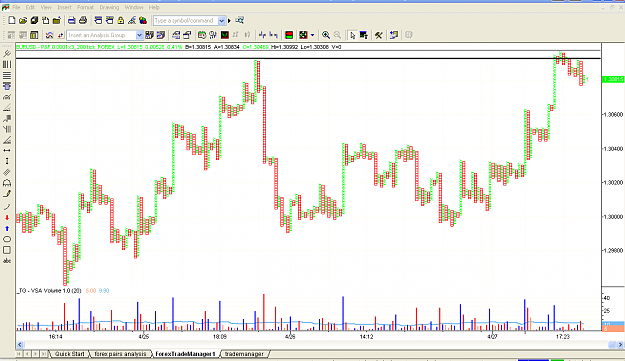
Mima, here are the charts. Left is 15min and right, 200 ticks. The red squares mark the same price points in both charts so you can have a reference point to compare from. image Hope it helps. If not, let me know!
vsa with Malcolm
- joaoborras replied Apr 29, 2013
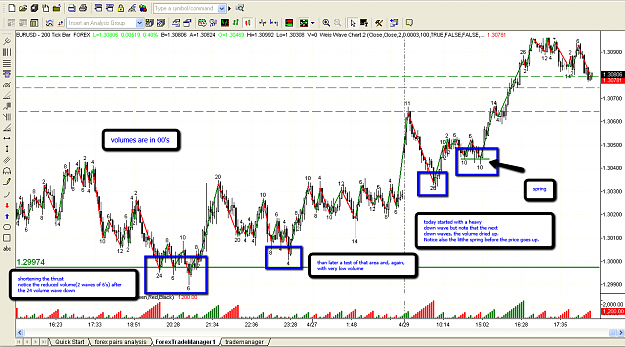
Another way that I am falling in love to analyse the markets is with the Weis Wave(though am just starting and have a lot learn yet). Below is a 200 ticks from TradeStation. The Weis Wave is set for a reversal of 3 pips. image For the guys that ...
vsa with Malcolm
- joaoborras replied Apr 29, 2013
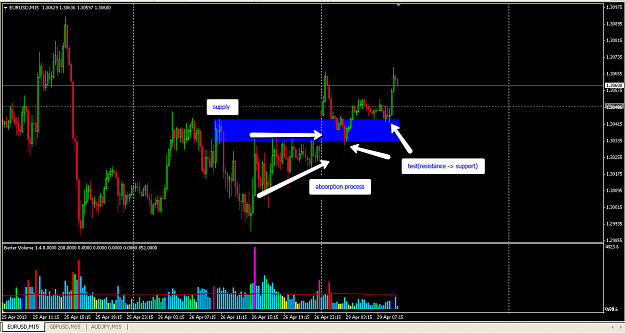
I do agree with that HV bar. I also was thinking the best way to interpret it. Here I try to make a case for an absorption process that took place. image Let's see what happens.
vsa with Malcolm
- joaoborras replied Apr 29, 2013
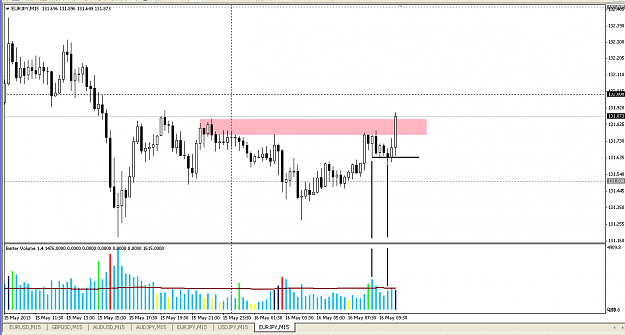
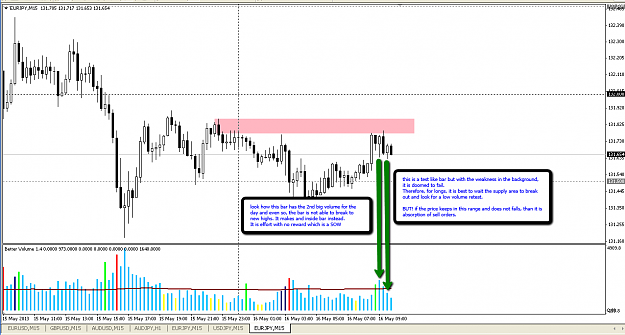
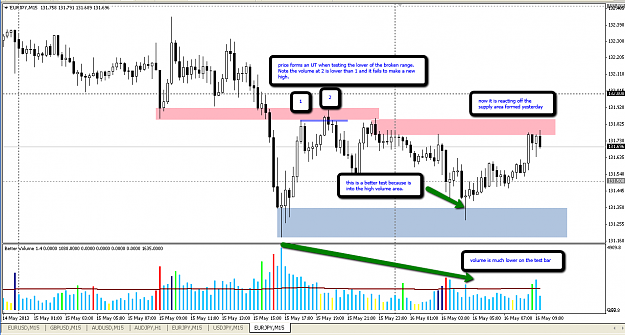
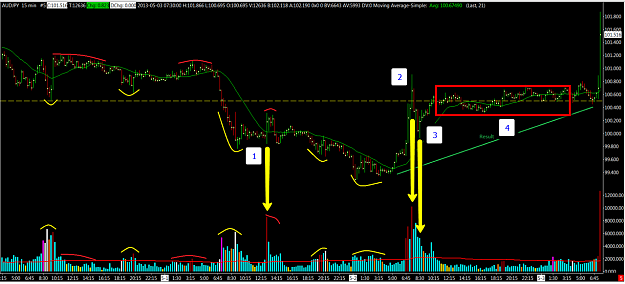
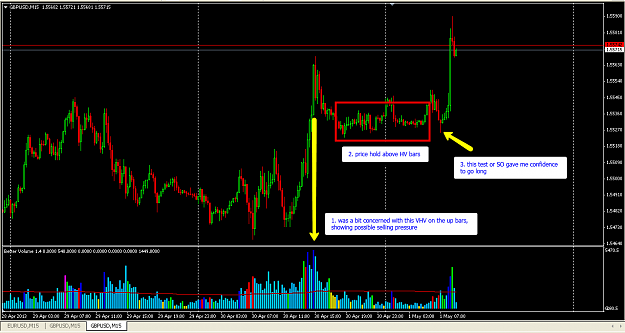
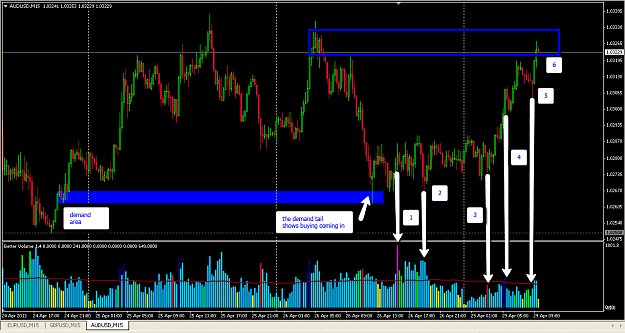
Here is my view on this one(15min chart): image Bar 1 is a HV up bar(SOW). The subsequent price action does not violate the lows, and is also with HV(bar 2), showing buying is coming in. Bar 3 is today's Asia. HV(relatively speaking) on a down ...
vsa with Malcolm
- joaoborras replied Apr 29, 2013
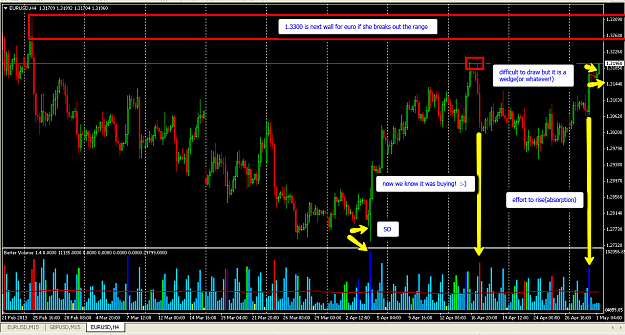
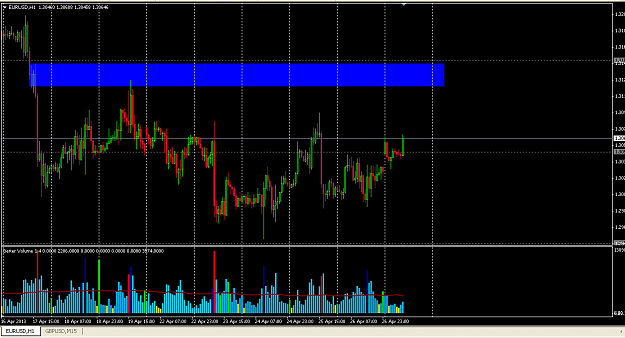
Euro still showing strength.... Here is a 15min chart: image But we have to break this resistance area on the 1hr chart. image If she breaks out there, 1.3250 and 3300 become possible, as SD said. And right now, eurusd is testing the Asian ...
vsa with Malcolm
- joaoborras replied Apr 25, 2013
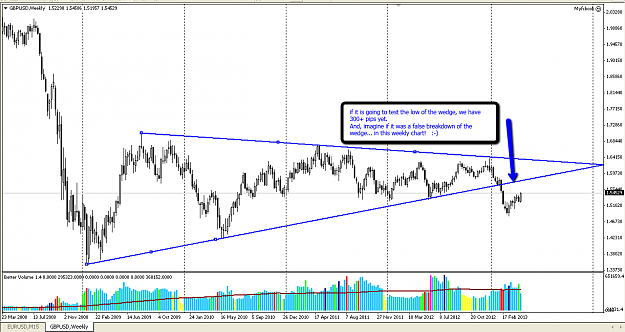
a bit longer term view for cable. This is a weekly chart: image Remember that COT data is showing a very bullish picture for sterling. If euro really dumps, we can see a capital flow from euros to sterling, fueling this up move. Also, with ...
vsa with Malcolm