- Search Crypto Craft
- 388 Results (1 Thread , 387 Replies )
-
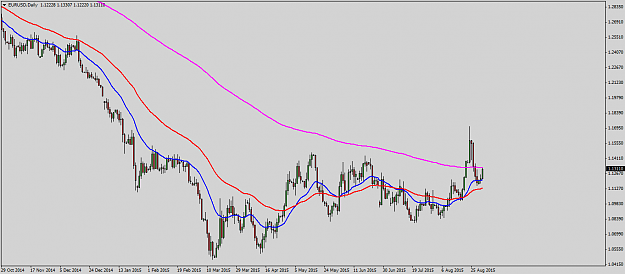
 jack.canadia replied Sep 1, 2015
Re-testing the 200 day EMA. Still above the 21 and 55 day EMAs. Bullish. image
EURUSD
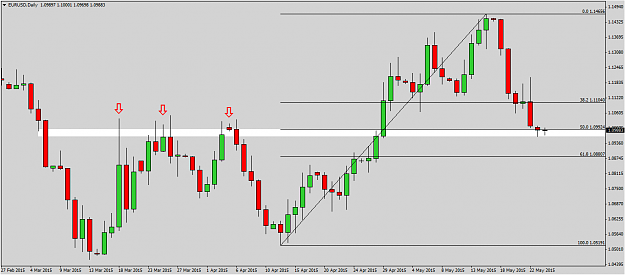
- jack.canadia replied May 24, 2015
Taking long here @ 1.0990 Pullback to former resistance, also a 50.0% fib. See daily chart. image
EURUSD
- jack.canadia replied Feb 5, 2015
Spot on!! My trade above stopped at break even, re-entered long last night at 1.1310 Going to let it run. image
Jack.Canadia's Trades
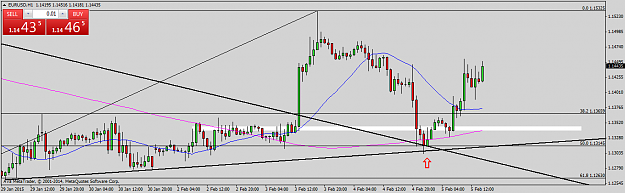
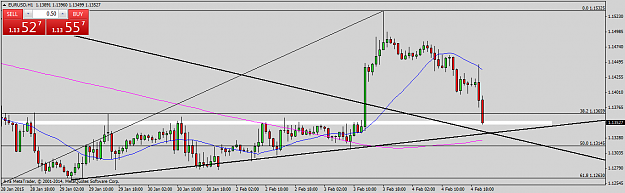
- jack.canadia replied Feb 4, 2015
Entered the zone. Original buys were cancelled at the news release. Looking to buy closer to 1.1330 at the trendline confluence image
Jack.Canadia's Trades
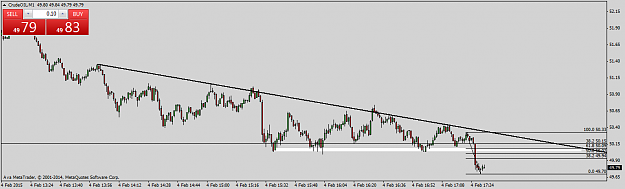
- jack.canadia replied Feb 4, 2015
Crude Oil - Short Trade Idea Just broke down through $50. Short a retracement to this level (around $49.95) Target $48.90 (50% fib). See charts above for the fib levels. image
Jack.Canadia's Trades
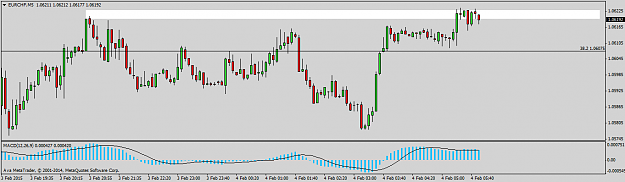
- jack.canadia replied Feb 4, 2015
EUR/CHF - Trade Idea (Long) Breakout play to the upside. Currently at a double top with 38.2% fib below from the entire drop down. Stop no more than 20 pips away. image
Jack.Canadia's Trades
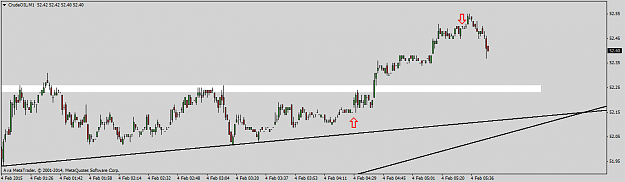
- jack.canadia replied Feb 4, 2015
Caught a nice $0.35 move in oil on the breakout play above. Scaled out. Entered 52.15 Exit 52.50 Rest in the money @ SL 52.25 Target $53.35 on the remainder. image
Jack.Canadia's Trades
- jack.canadia replied Feb 3, 2015
Crude Oil - Trade Idea (based on above) It's tough to really call a specific trade. Even more so a hard bottom. Anyway, this is the first, IMO, meaningful rally amidst a huge sell off. Check the chart for some ideas and be careful, this thing moves ...
Jack.Canadia's Trades
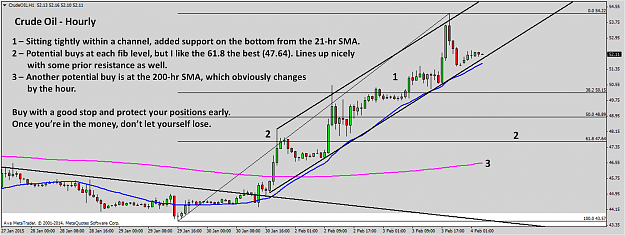
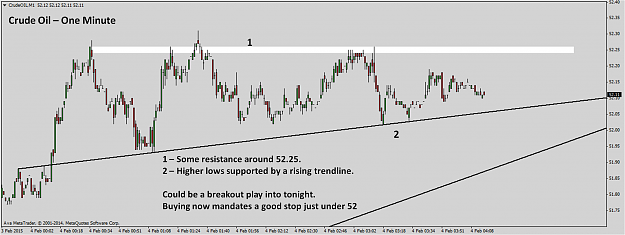
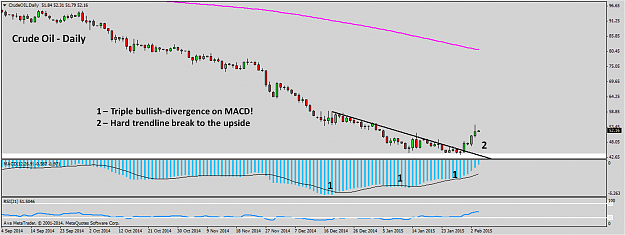
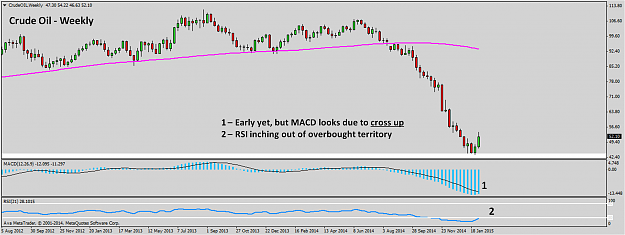
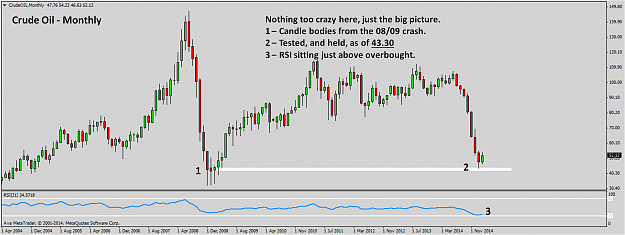
- jack.canadia replied Feb 3, 2015
Crude Oil Analysis - February 3, 2015 Follow the charts below in succession from Monthly, Weekly, to Daily. Just a small rally, or could it be more? Check the charts below. I'm turning bullish. image image image
Jack.Canadia's Trades
- jack.canadia replied Feb 3, 2015
EUR/USD - Trade Idea (based on above) Buy zone 1.1350 - 1.1365 My open orders: Buy limits @ 1.1370, 1.1360, 1.1355 Stop Loss - 1.1310 Target - 1.1680 (just below 138.2 fib extension of the fib in the image) No guarantees. image
Jack.Canadia's Trades
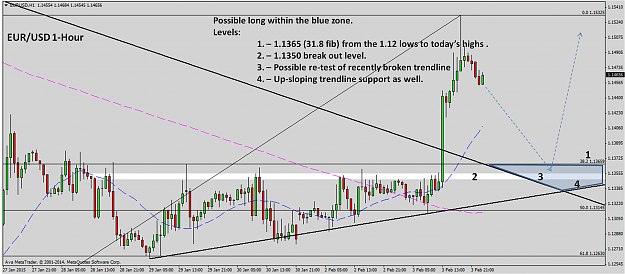
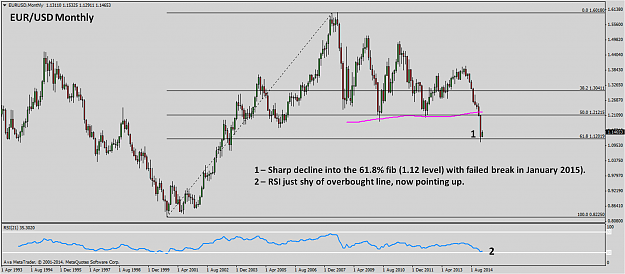
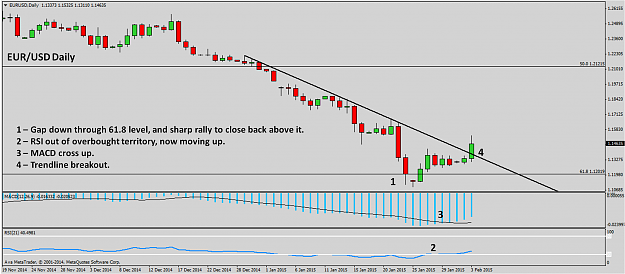
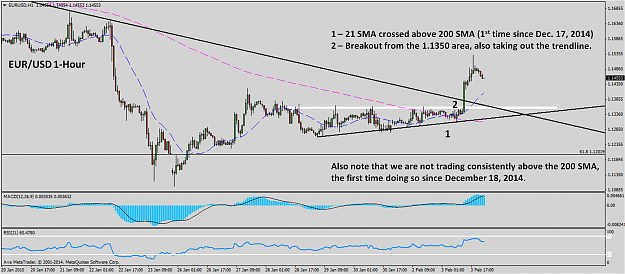
- jack.canadia replied Feb 3, 2015
EUR/USD Analysis - February 3, 2015 Follow the charts below in succession from Monthly, Daily, to Hourly. I think we may be setting a bottom here. image image image
Jack.Canadia's Trades
- jack.canadia replied Oct 19, 2014
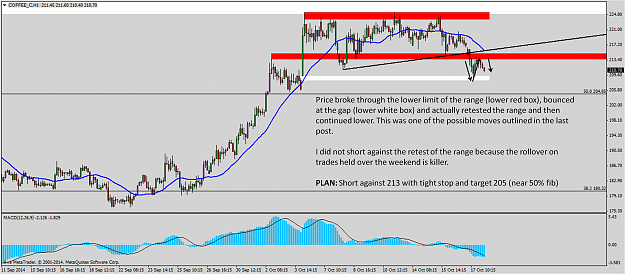
COFFEE-C Update See chart. image
Jack.Canadia's Trades - Coffee/Corn + Others
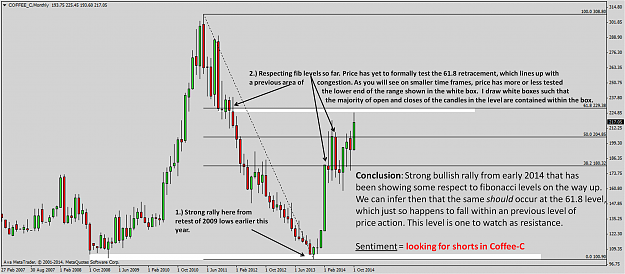
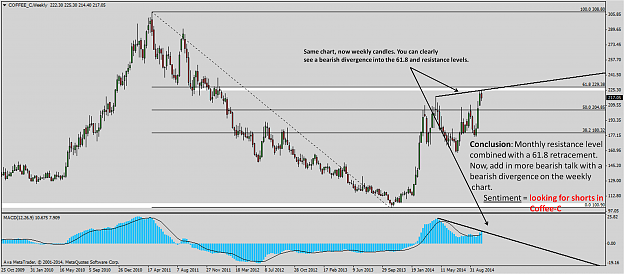
- jack.canadia replied Oct 16, 2014
Coffee-C Futures Analysis - SUMMARY Strong bullish rally in Coffee-C beginning late 2013. PA has show some respect to the 38.2% and 50% fib levels on the way up. PA has entered into a previous level of congestion seen on the monthly timeframe (as ...
Jack.Canadia's Trades - Coffee/Corn + Others
- jack.canadia replied Oct 15, 2014
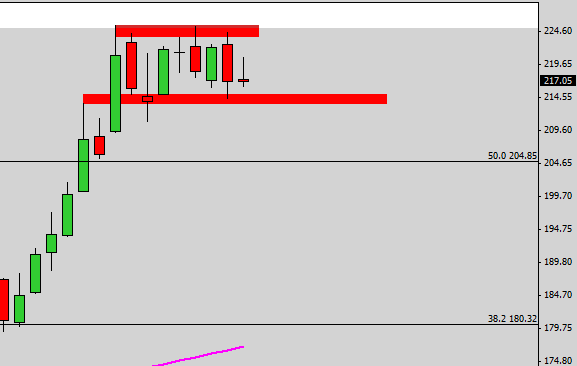
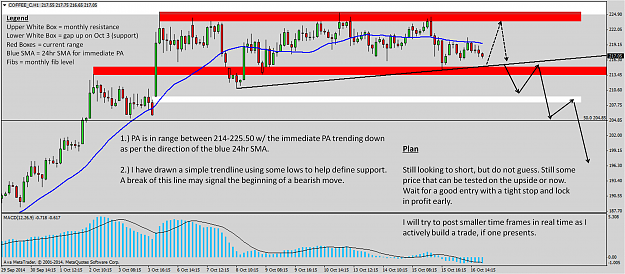
Coffee-C Futures Analysis See the following charts. Looking for shorts. Smaller timeframes to follow. image image
Jack.Canadia's Trades - Coffee/Corn + Others
- jack.canadia replied Dec 12, 2013
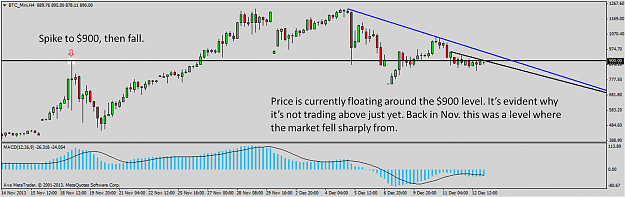
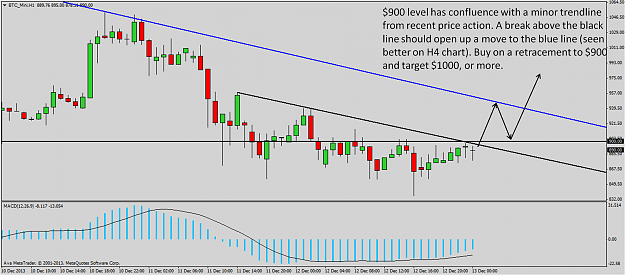
A couple charts below ... FYI, my charts don't capture all the price action as my broker closes trading at 1700 EST on Friday and opens at 1700 EST on Sunday. 4-Hour Chart - Note on the left of the chart the spike to $900 and fall. Also note the ...
Bitcoin technical analysis
- jack.canadia replied Jun 20, 2013
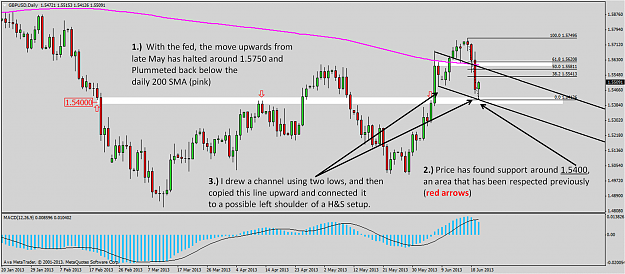
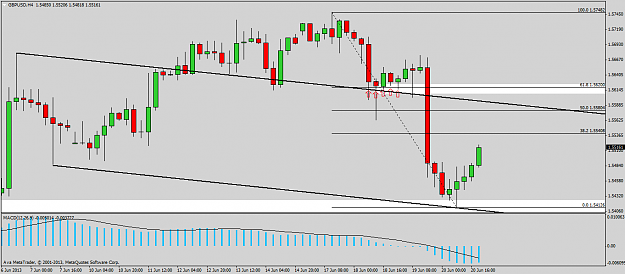
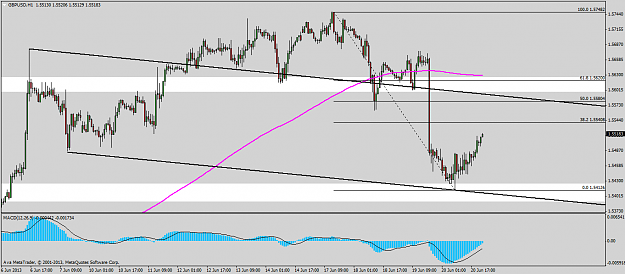
GBP/USD Short Trade Daily Chart After reviewing the chart I have posted, I am looking to short in the area of the daily 200SMA, white box (possible left shoulder of a H&S pattern), and 61.8% retracement of the move downwards to 1.5400. This low at ...
Jack.Canadia's Trading Log
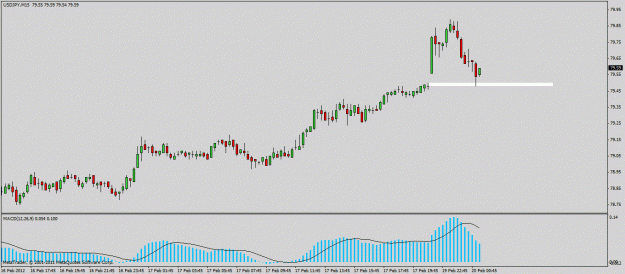
- jack.canadia replied Feb 20, 2012
Is that close as of 5pm EST? The MT4 platform I use for charting closes as 00:00 GMT and it did not form a doji. I am still long this pair.
USD/JPY Discussion
- jack.canadia replied Feb 19, 2012
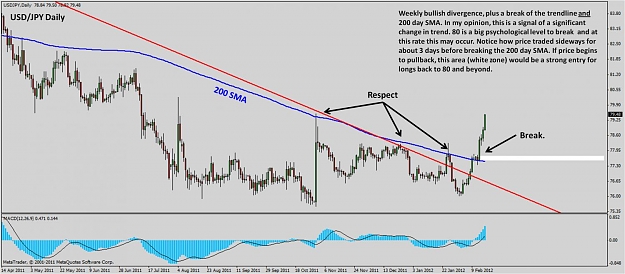
Some simple charts below. Still bullish, but on a pullback look to buy near 77.70
USD/JPY Discussion
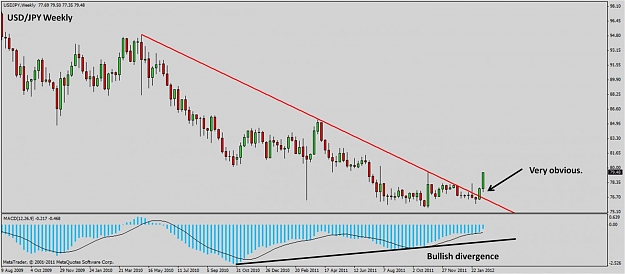
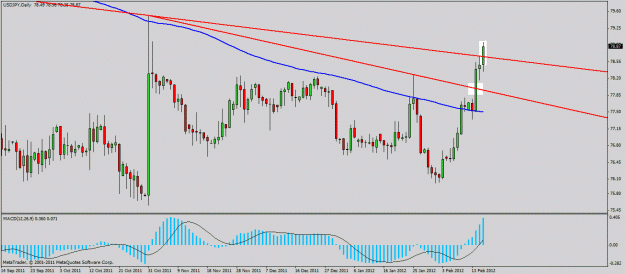
- jack.canadia replied Feb 16, 2012
Bias is up now and will continue to buy. I remain long. Above 80, skys the limit. Edit: Lest we forget the 200sma has since been crossed and closed above.
USD/JPY Discussion