- Search Crypto Craft
- 40 Results
-
 iusman23 replied Jan 24, 2024
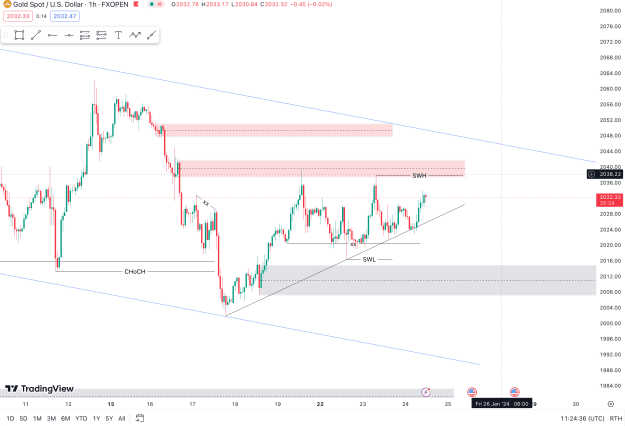
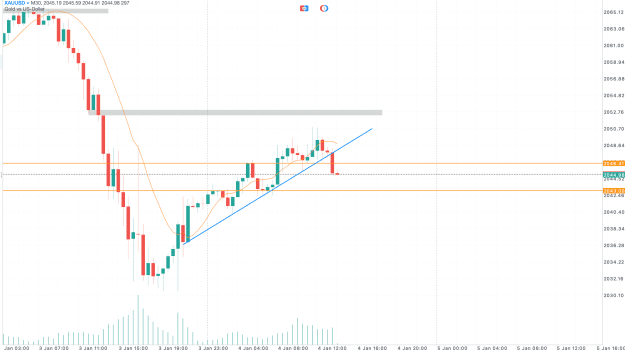
image Buys in Demand Zone in 2014 and Sells in Supply Zone in 2041. Gold looks confusing today.
Gold
- iusman23 replied Jan 23, 2024
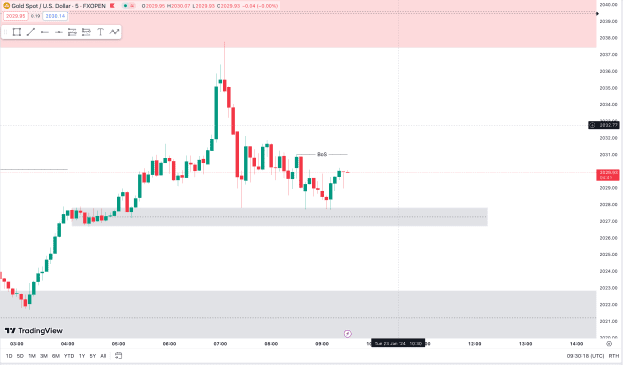
image Being patient for my area. Come on man fall down so I can buy there.
Gold
- iusman23 replied Jan 23, 2024
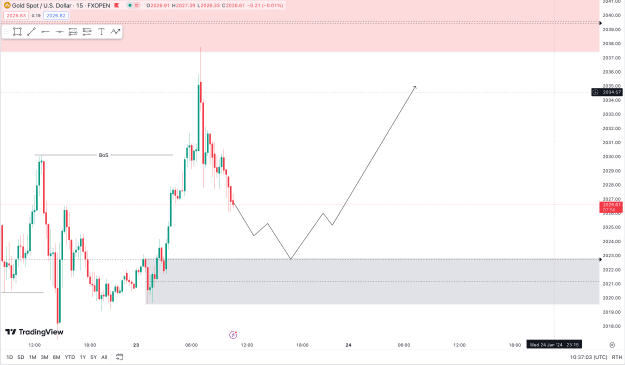
image Waiting for this structure to break for entering long. Volume is so dead. Edit: the price is moving lower, better for a good long bullish run.
Gold


- iusman23 replied Jan 18, 2024
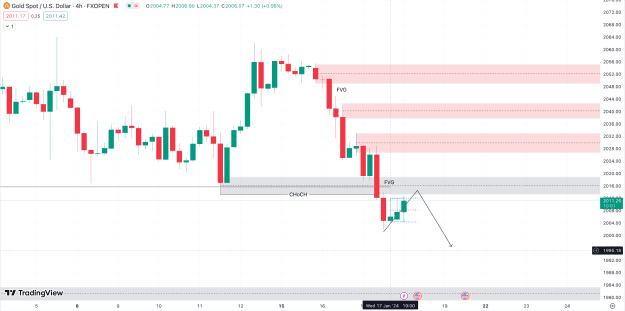
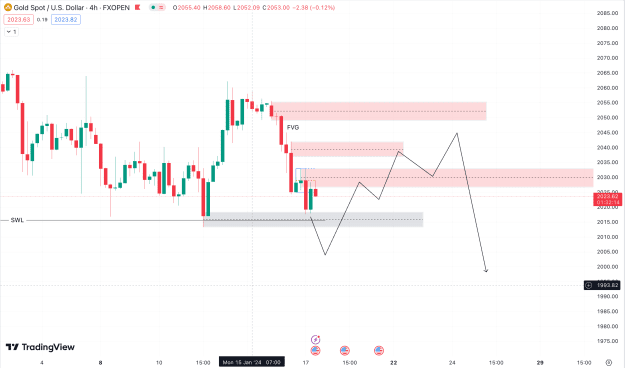
image Rejection on the Imabalnce for the second time. Looks like we are heading to 1980 area.
Gold
- iusman23 replied Jan 17, 2024
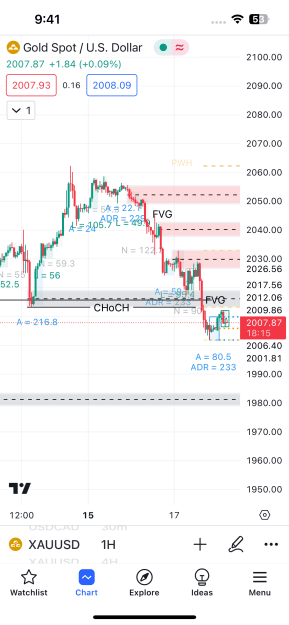
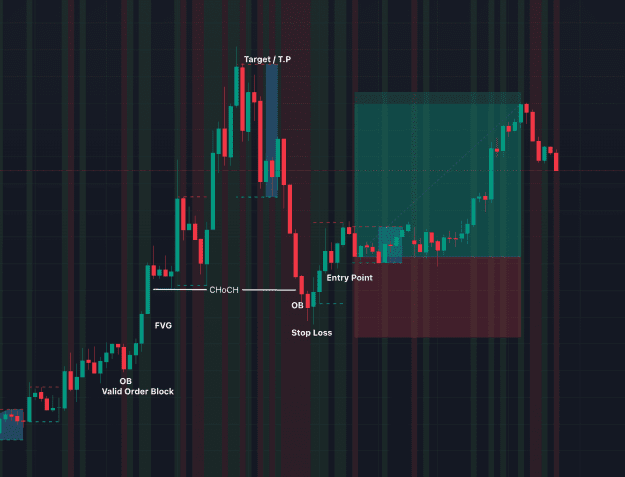
image Possible scenario according to SMC. The structure is now broken (CHoCH). If it cannot fall further, we can see a retracement to 2045 to the Imbalance (FVG) area. Keeping in mind that 2045 is also a strong support. Then gold will continue to ...
Gold
- iusman23 replied Jan 17, 2024
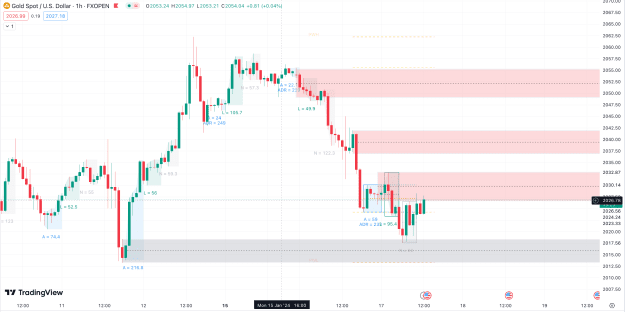
image Marked some supply and demand zones on H1. Price is respecting these areas. Waiting for the 2032 area. If the price closes above 2032. I am looking forward to the 2037 area. If price rejects the 2032 supply zone. I will be looking for an ...
Gold
- iusman23 replied Jan 15, 2024
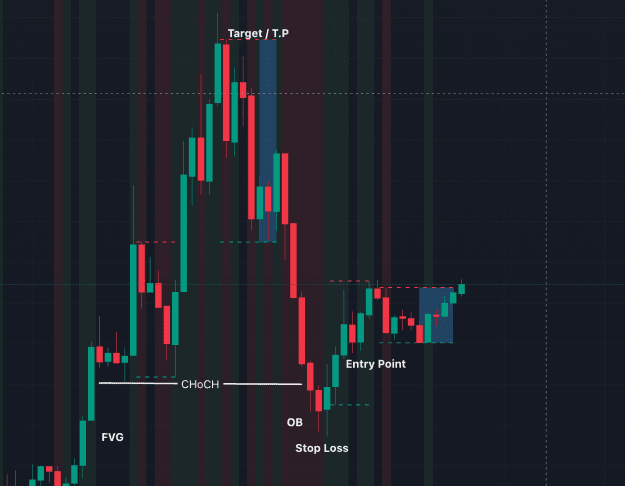
image Before image After Thesw are SMC analysis I did yesterday and here are the results. Ps: I move tp lower a bit later.
Gold
- iusman23 replied Jan 13, 2024
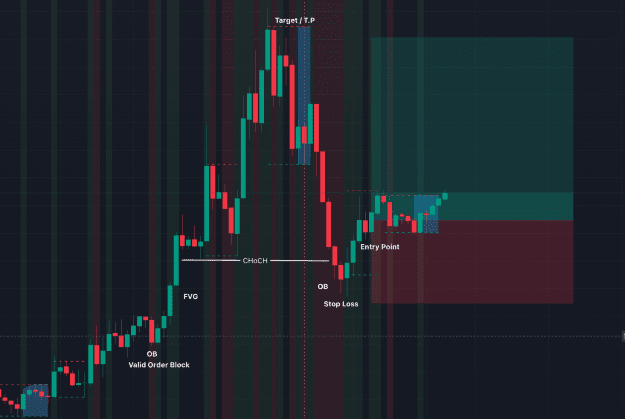
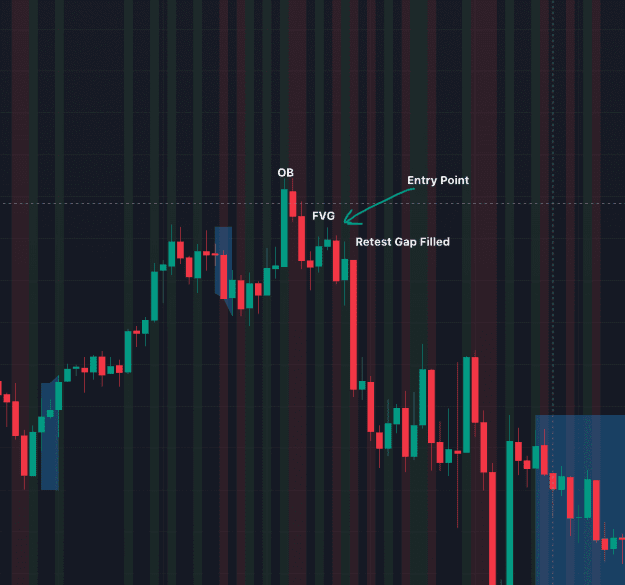
image image Can you look at the screenshots and confirm this is the same method you're talking about? You enter when price comes back, fill the fvg and at the same time candle rejects, you enter. Right?
Gold

- iusman23 replied Jan 13, 2024
image image Any SMC trader here can confirm if this is correct? This is the Gold chart from last Friday and a month ago. I'm practising SMC. A feedback to these charts will be helpful.
Cable Update (GBPUSD)


- iusman23 replied Jan 4, 2024
image Trend Breakout, waiting for a retest and a sell confirmation.
Gold, Daily
- iusman23 replied Jan 1, 2024
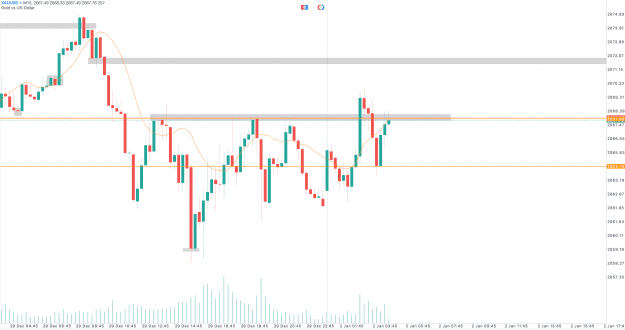
image Daily Analysis: Wish you all the best for trading in 2024. Here is my chart and set up on the screen you can see. => If price rejects 2067-68, wait for the sell confirmation. => If price do not respect resistance at 2068 and take support in ...
Gold
- iusman23 replied Dec 29, 2023
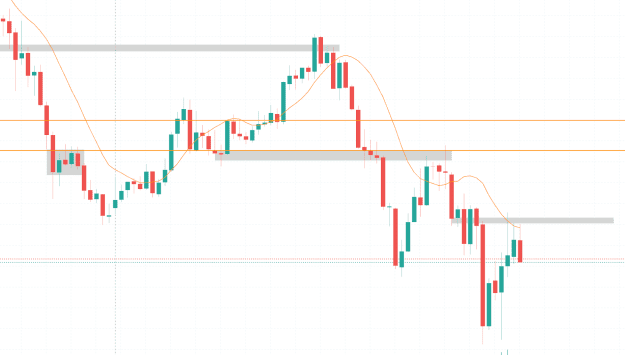
A perfect example of: Previous support can be future resistance and future resistance can be future support. Dear newbies. I am leaving this screenshot as a New Year's Gift for you all. There is a lot you can learn from this screenshot in the next 2 ...
Gold
- iusman23 replied Dec 28, 2023
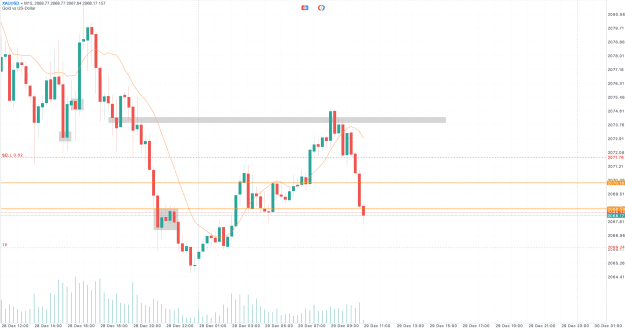
image Daily Analysis: TIP: Keep an eye on M15 and M30 for better entry points. We all know there's a strong resistance at 2070 and Gold is right below the resistance. The rejection from 2070 will push Gold down to the 2055 area. In another ...
Gold
- iusman23 replied Dec 17, 2023
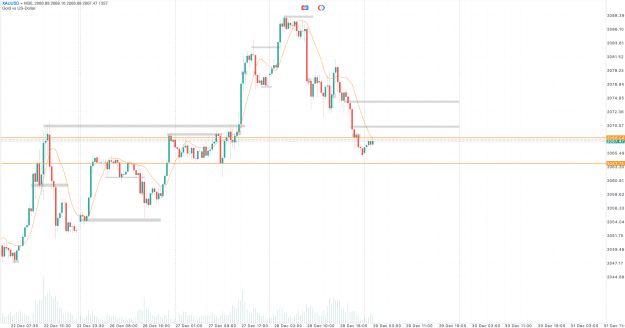
image Gold is bullish on Daily according to Fibonacci Retracement tool. The recent bearish candle is just a retracement according Fibonacci.
Gold
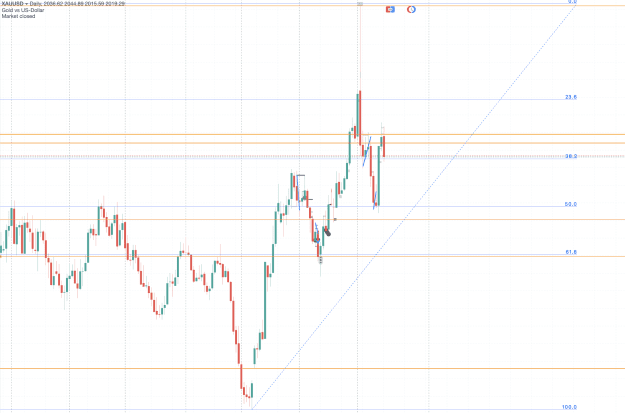
- iusman23 replied Dec 17, 2023
image Gold is still Bullish on Daily according to Fibonacci recent red candle is just a retracement.
XAU/USD & XAG/USD - Gold & Silver Traders Thread
