- Search Crypto Craft
- 8 Results
-
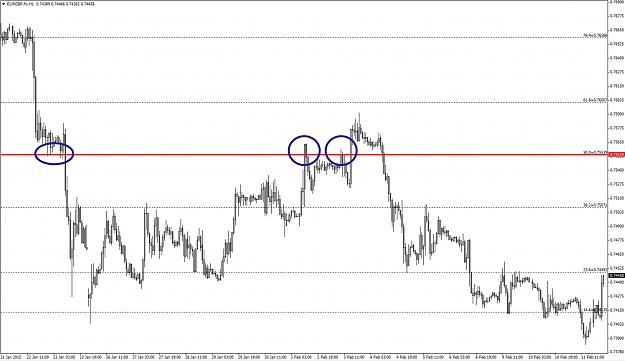
 invicta replied Feb 11, 2015
GreatNorth, I was interested to read your assertion in Post #1 that there is no 50% Fibonacci level. Yet the Wikipedia page you reference states that "The 0.500 ratio is derived from dividing the number 1 (second number in the sequence) by the ...
Using WM/Reuters Benchmark Rates in trading
- invicta replied Aug 19, 2013
I agree with Davidb's observation that trends can be in opposing directions on different timeframes, which is why I rarely draw trend lines. They always look so accurate on historic charts but can be misleading on live charts. I prefer to stick with ...
Trend identification and trend change spotting
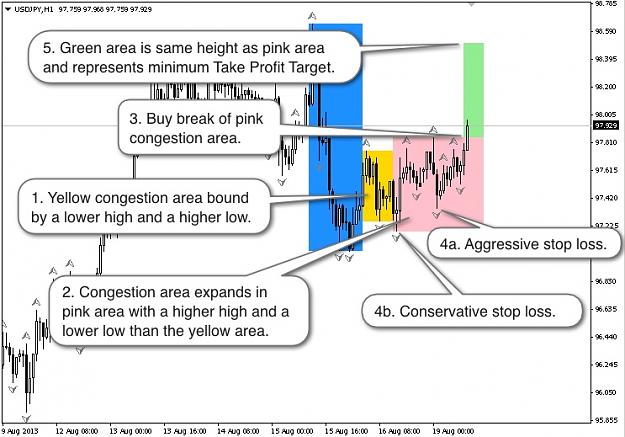
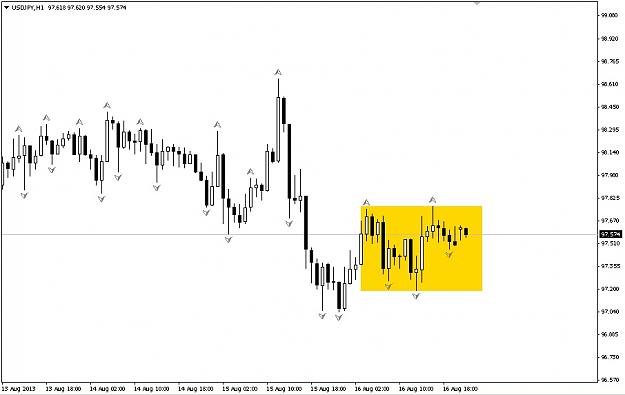
- invicta replied Aug 18, 2013
Dimkata, my reading is that the H1 chart of USDJPY is not displaying a clear trend in either direction and spent Friday, Aug 16 trading in a tight congestion range. Once price breaks out of this range we may be in a better position to detect the ...
Trend identification and trend change spotting
- invicta replied Aug 17, 2013
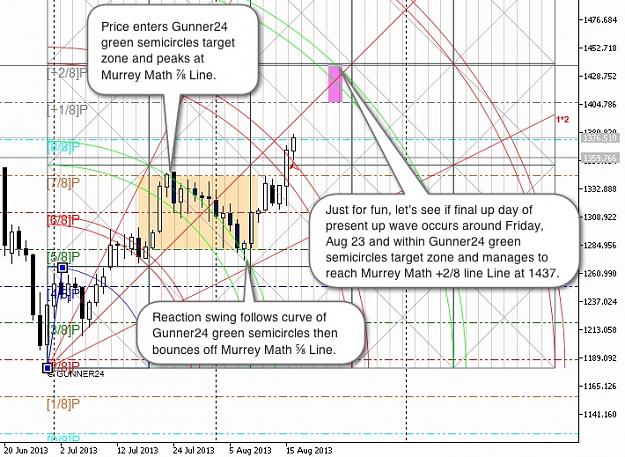
Starry, good work with your Gunner24 tool. Here's a chart of XAUUSD showing similarities between Gunner24 and Murrey Math Lines. The Aug 23 target date for the next high was calculated using John Crane's Reaction Count method as described in his ...
Fib Circle Line indicator
- invicta replied Aug 15, 2013
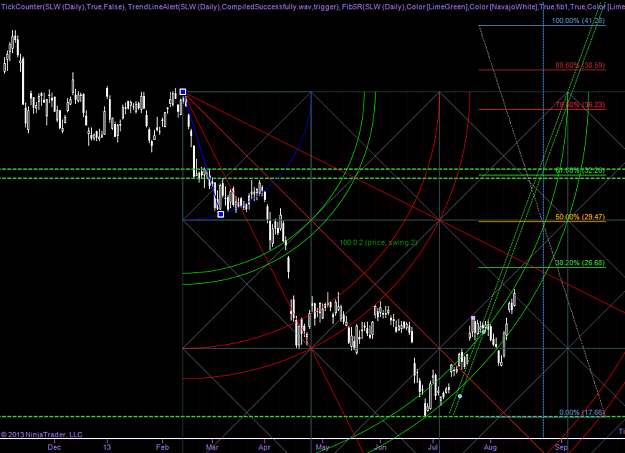
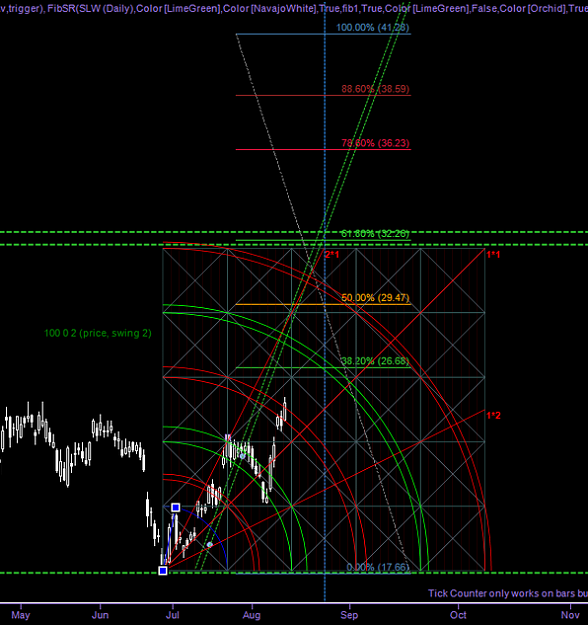
Starry, I believe you have discovered important market cycles with your circle tool. Similar work has been done by Eduard Altmann who has developed a tool called Gunner24 (a free trial can easily be found via Google) that makes an overlay on any ...
Fib Circle Line indicator
- invicta replied Aug 7, 2013
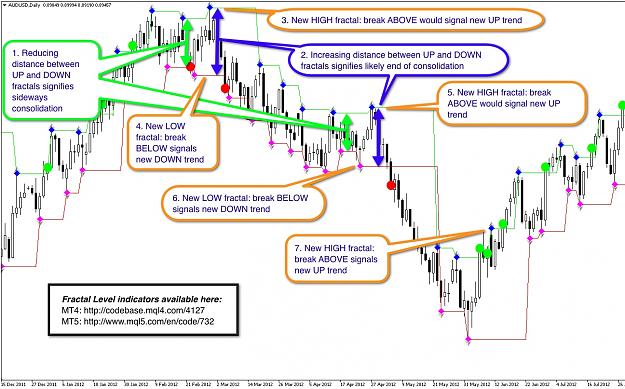
My trend definitions are as follows: UP trend: Price makes higher highs and higher lows (staircase going UP). UP trend likely ends when price makes lower high or lower low. DOWN trend: Price makes lower lows and lower highs (staircase going DOWN). ...
How do you know when the trend is over?
- invicta replied Oct 13, 2012
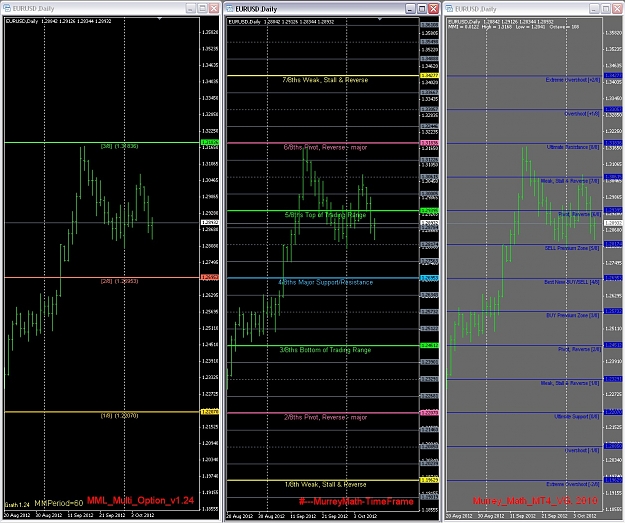
All three charts are using the same broker: FxPro. All three indicators are using a period of 64. However I just realised that, unlike the other two, the MML_Multi_Option indicator has to be set to the time frame that the user wishes to display. I ...
Murrey Math Daily System
- invicta replied Oct 10, 2012
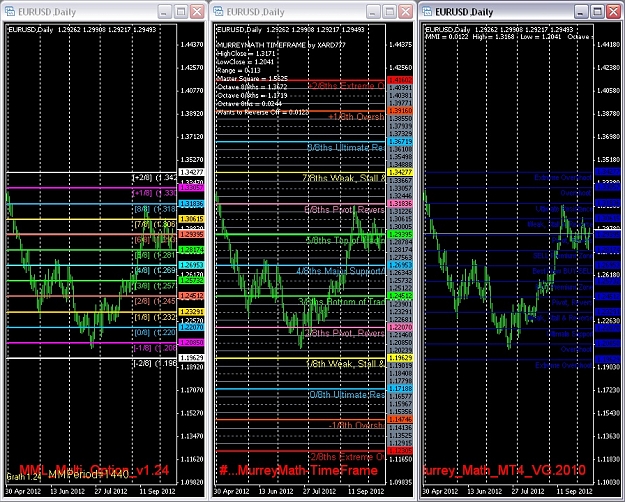
MML indicator variations — The attached pic shows three daily charts of EURUSD for the past 37 days. Each has a different Murrey Math Lines indicator attached as per the indicator name in red at the bottom of each chart. Whilst they all agree ...
Murrey Math Daily System
- Posts by Member Search: 'invicta'