- Search Crypto Craft
- 92 Results
-
 ikdenk replied Jun 11, 2023
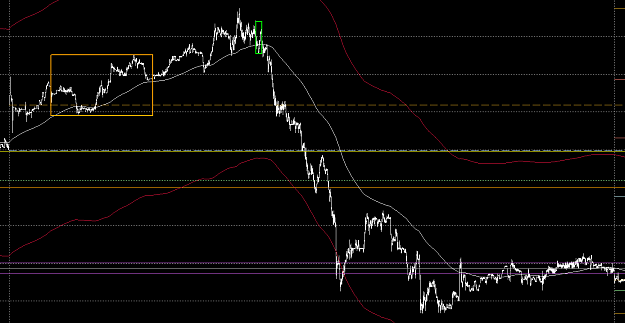
Hello fellow Volman traders! Attached is a screenshot of my last three trades on Friday, two wins and one loss. image
Volman Style (70-tick chart)
- ikdenk replied Dec 8, 2022
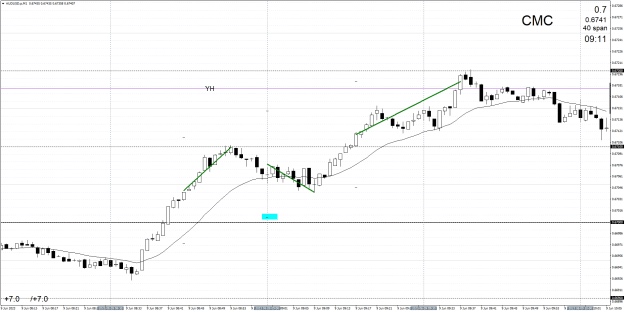
Dedicated to Lem, for his encouragement, positivity and patient help for his fellow traders here and in the alien sphere. image image
Trading is as simple as 1-2-3
- ikdenk replied Nov 21, 2022
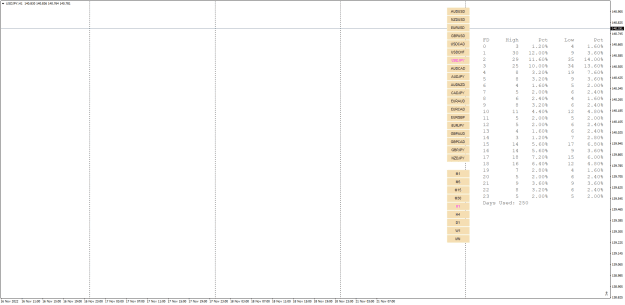
Your dashboard is so much different than mine, why would that be? image A month should not make that much difference over a 250 day frequency distribution.
Trading is as simple as 1-2-3
- ikdenk replied Aug 11, 2021
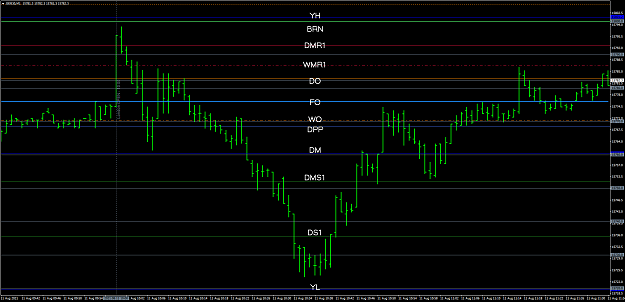
Please allow me to overlay some pivot levels on your chart to help in your execution. Pivots act as POTENTIAL support and resistance. image
The Good, The Bad and The Ugly - A Real Trading Record
- ikdenk replied Sep 11, 2020
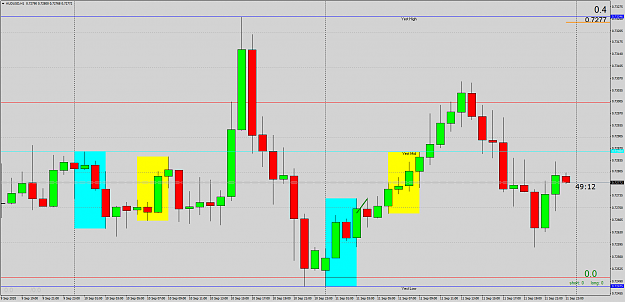
You are using quite a different range than the 'original' on this thread. Yours is in Aqua, the 'original' is in yellow. They obviously both work! I got my 5 pips on the Tokyo Open today, using the first three candles. image
Billytt Die happy trading e/j daily breakout
- ikdenk replied Sep 3, 2020
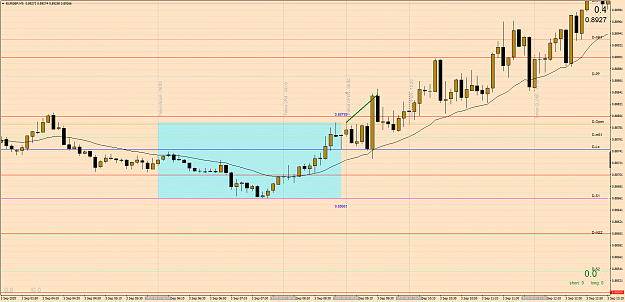
One for Lem: 5 pips on Frankenbreak. Looking forward to your redux version. image
Billytt Die happy trading e/j daily breakout
- ikdenk replied Jul 6, 2020
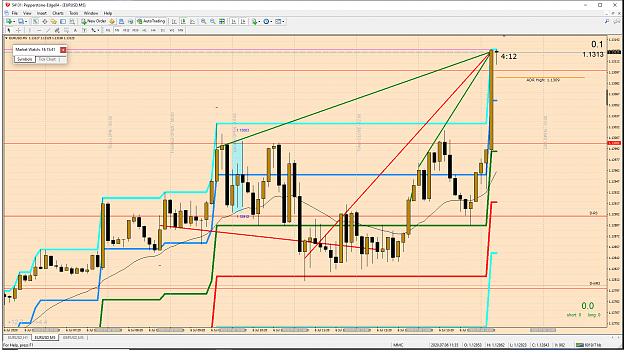
Countering also works on eurusd (obviously). A combination of chipping away at the limbo and waiting for the inevitable test of the high, towards ADR. +4.4 pips nett image Good night, bedtime.
Billytt Die happy trading e/j daily breakout
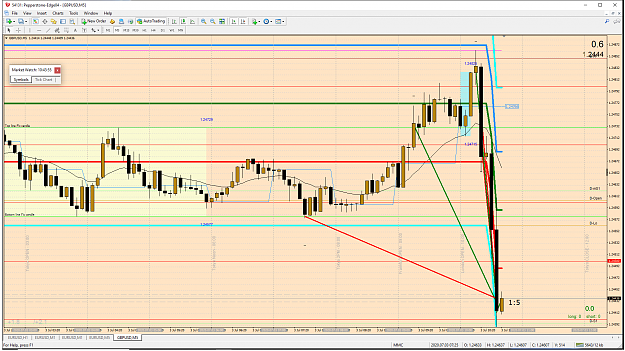
- ikdenk replied Jul 3, 2020
I did it the other way around. 00.00 - 04.00 fail and hedge then tried to fix it with 08.15 - again fail and hedge. Then added sell below 08.15 Five trades in total out for a few pips. The trades are shown below in green and red. Bit hard to see, ...
Billytt Die happy trading e/j daily breakout
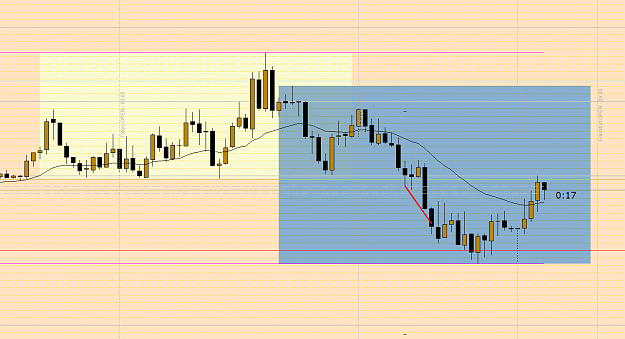
- ikdenk replied May 28, 2020
?? I took 5 pips short from the same. Chart GU 5 min: image Yellow box is Billy's 00:00 to 04:00 UK time Blue box is Claudia's little blue box, still developing until Franky Open.
Billytt Die happy trading e/j daily breakout
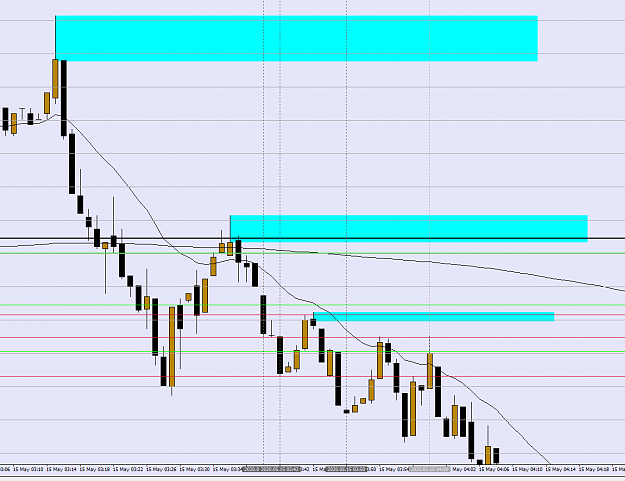
- ikdenk replied May 15, 2020
Lem, I am trying to understand your logic here: image lime lines are your entries crimson lines are your TP (approx. 100,50,35 - preset?) vert lines are your screenshots thick black line = Daily Open Very Volman like - double doji at 20 ema, (first ...
Billytt Die happy trading e/j daily breakout
- ikdenk replied Apr 12, 2020
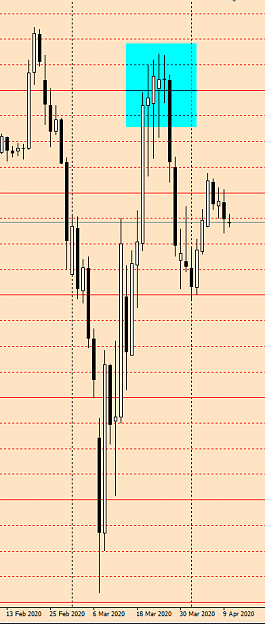
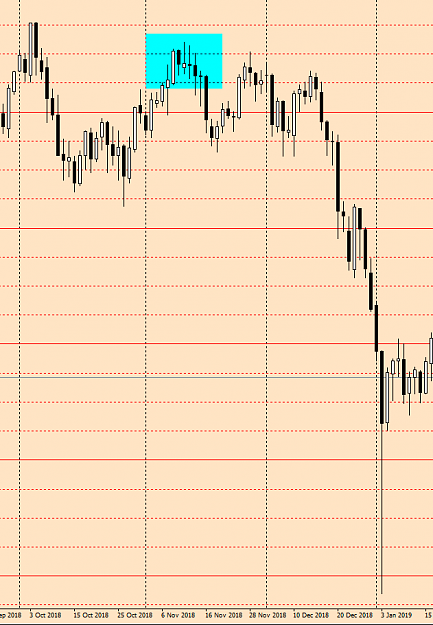
@ PokerChip Why does this not qualify as a reversal on the usdjpy daily, please? image It has happened before like this. image
The Jail Break System
- ikdenk replied Jan 27, 2020
Thank you. finally-2020 must have modified this later, judging by the sequence of his charts. In the mean time I have found a similar short version, as attached. Unfortunately only have the ex4 version so far. file image Very useful indeed: when ...
Pivot Trading
- ikdenk replied Dec 20, 2019
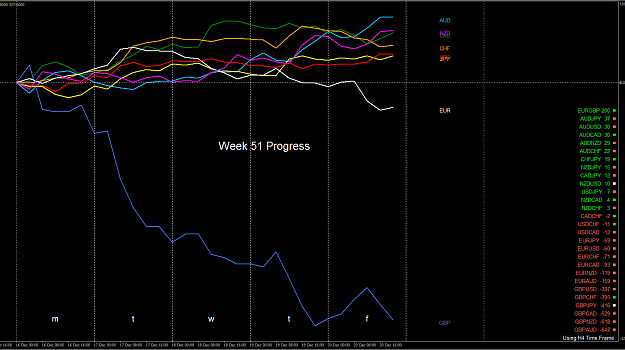
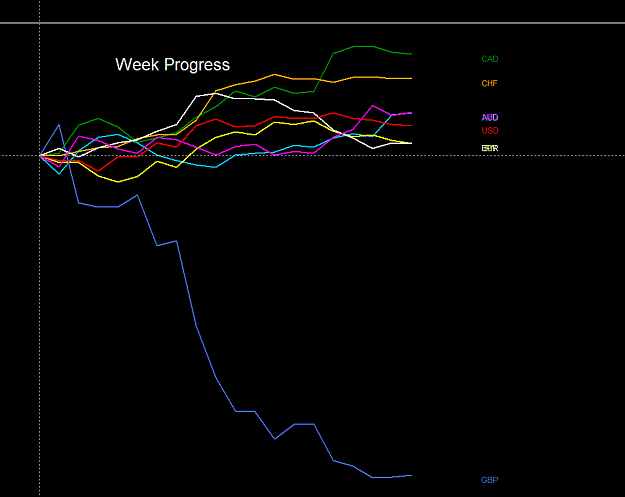
Week 51 in the rearview mirror. The currency lines are the accumulation of the 28 currency pair movements shown on the right. Massive sell off on the GBP. When will it reverse? Late week mark ups (downs) on the EA and EN. Opportunities for next week ...
Pivot Trading
- ikdenk replied Nov 11, 2019
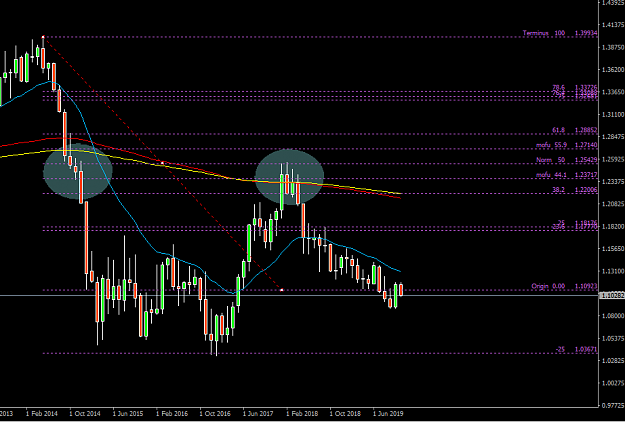
Found an interesting move on the monthly with a target of around 1.034 image
The Swamp

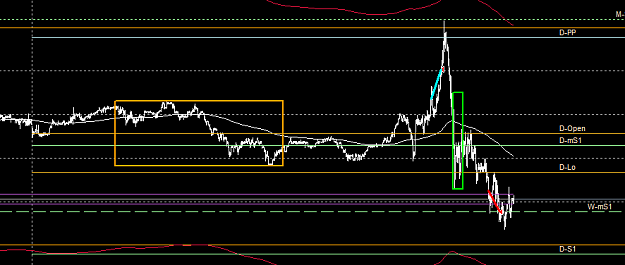
- ikdenk replied Nov 5, 2019
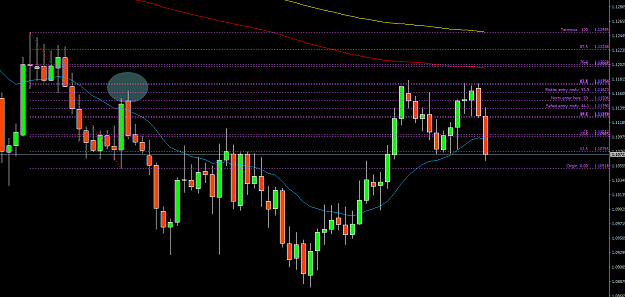
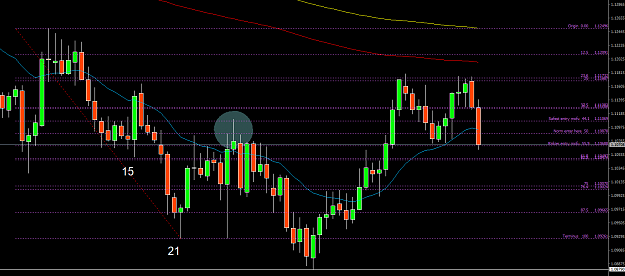
Gator, your H4 August move on the daily and an alternative, 15 and 21 days respectively. Both rejected at the 50% retrace. image image See the matching down spikes and footprints.
The Swamp
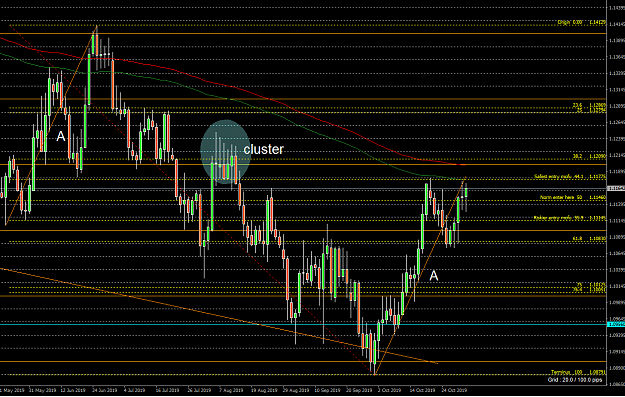
- ikdenk replied Nov 1, 2019
Still in the mofu zone. Will be hard to chew through the August cluster. As noted before A = A. image
The Swamp
- ikdenk replied May 28, 2019
Having your cake and eating it too. 2 x 5+ image gbpusd 1 minute chart
Billytt Die happy trading e/j daily breakout
- ikdenk replied May 27, 2019
Understood. It's the combination of the two that is important. It is as if the midnight 4H bar sets the true value of the pair before the manipulation starts. There are then different scenarios for the combination of the two, one of them like ...
Billytt Die happy trading e/j daily breakout