- Search Crypto Craft
- 20 Results
-
 hsa013 replied Oct 13, 2010
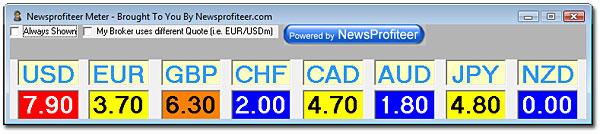
Hi Tea_trader, How about this? It's called currency strength meter, uses MT4 feed. It is a free software, and I hope it is not considered advertising posting its link. You can grab it here. hsa
vsa with Malcolm
- hsa013 replied Oct 8, 2010
yeah, the smart money always knows which side to play. it's not an accident that they bought heavily before the news... easy money!
vsa with Malcolm
- hsa013 replied Sep 24, 2010
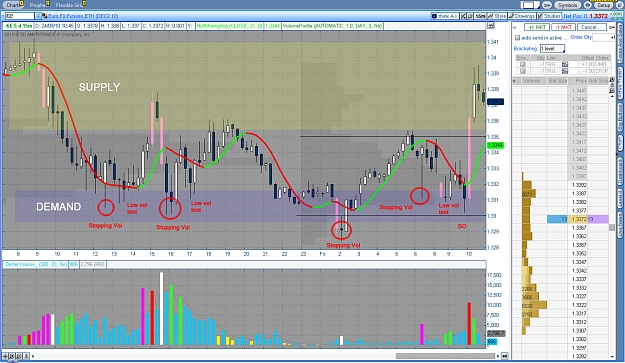
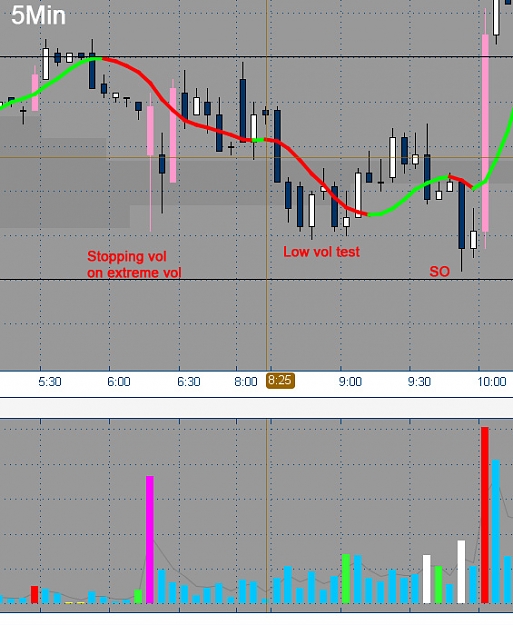
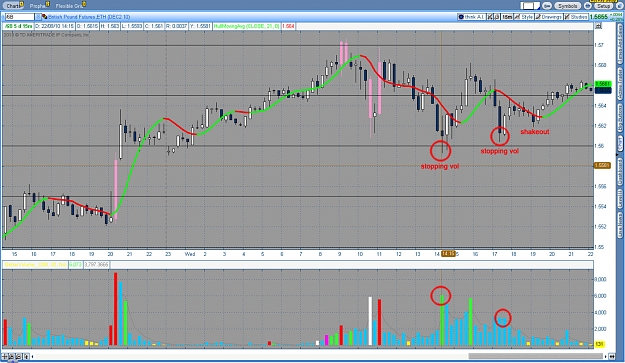
EU strength — I think EU background was full of strength before news. Multiple Stopping Vols and low vol tests all around. (Especially that huge Stopping Volume bar in the morning) See my interpretation.
vsa with Malcolm
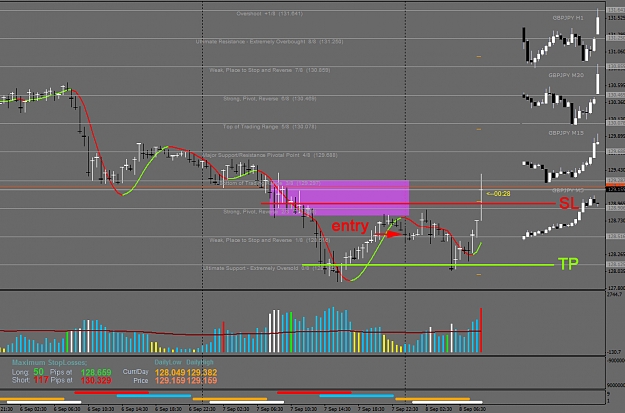
- hsa013 replied Sep 22, 2010
Malcolm, May I ask what were your entries on these stopping volume setups? Right after you saw the stopping vol bar you bought? I was trading these too but I thought they were risky trades. Price was neither above Hull nor the Hull was green - not ...
vsa with Malcolm
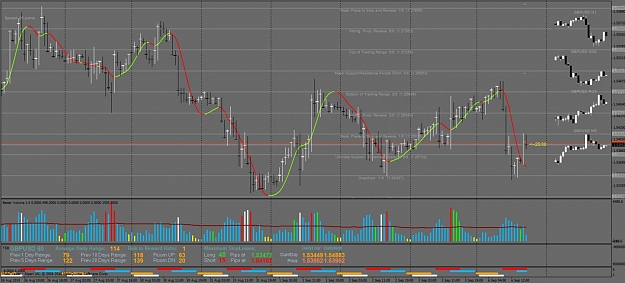
- hsa013 replied Sep 10, 2010
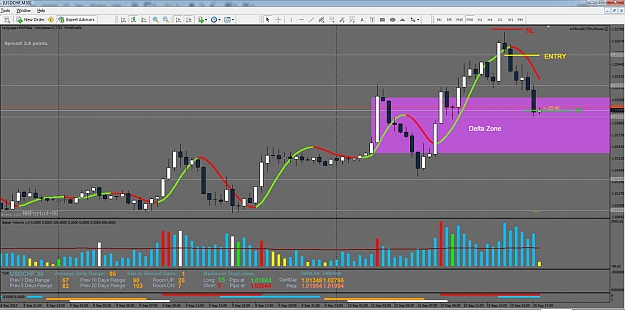
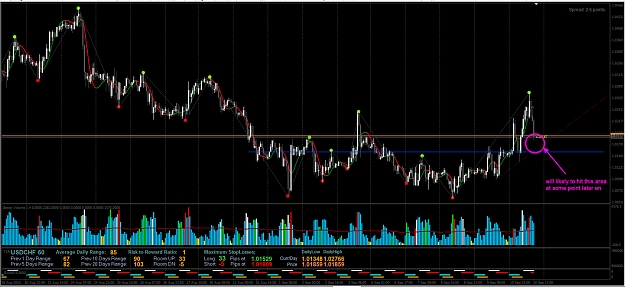
Another beautiful example. I watched swissy futures and took the trade on USDCHF. (I know it's dropping further at the moment but I reached my daily target and didn't want to spend more time with it) Looking at VSA setups on futures is just SO MUCH ...
vsa with Malcolm
- hsa013 replied Sep 10, 2010
This is a textbook example VSA setup. I like what I saw today morning, so I didn't hesitate and pressed buy.
vsa with Malcolm The images speak for themselves.
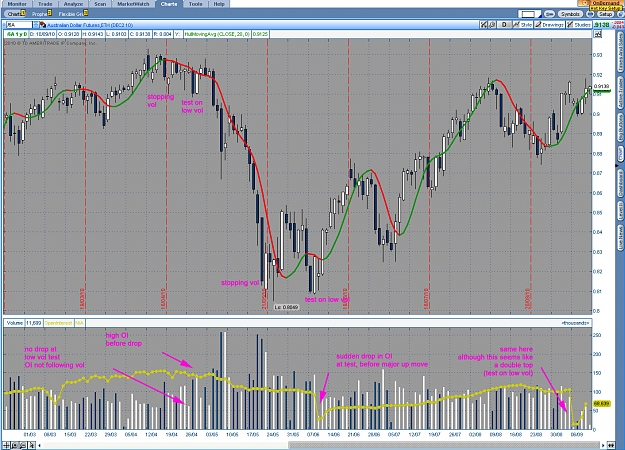
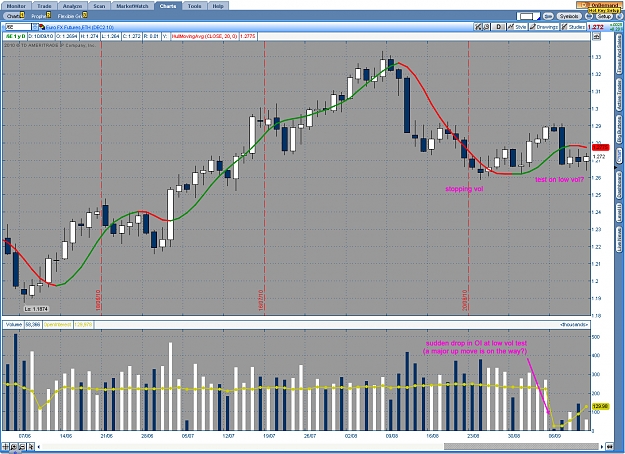
- hsa013 replied Sep 10, 2010
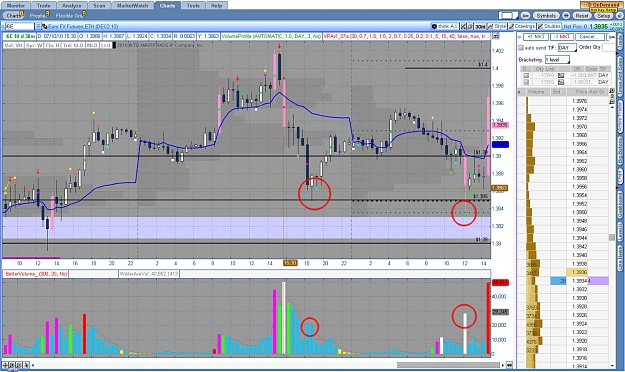
Malcolm, as you're constantly monitoring futures do you also watch open interest (eg. on Daily) or you do not consider it an important factor? See attached charts, it seems it might reinforce the facts what we see in VSA? Pity I can't see changes on ...
vsa with Malcolm
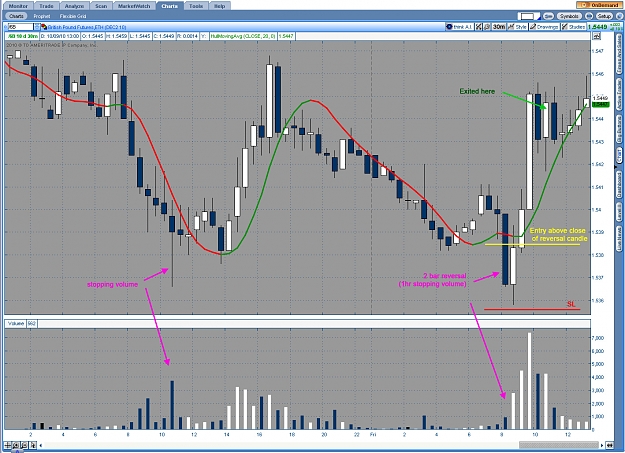
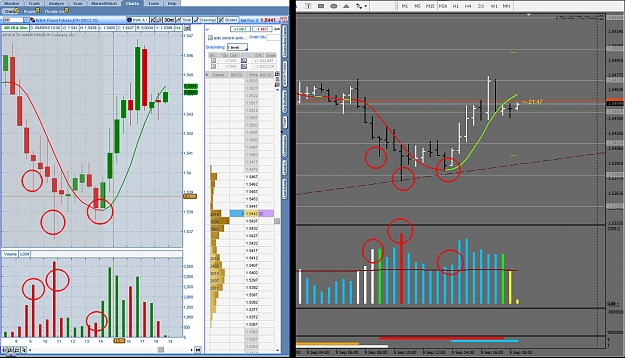
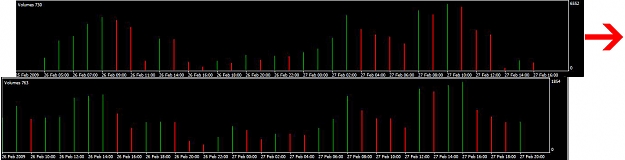
- hsa013 replied Sep 9, 2010
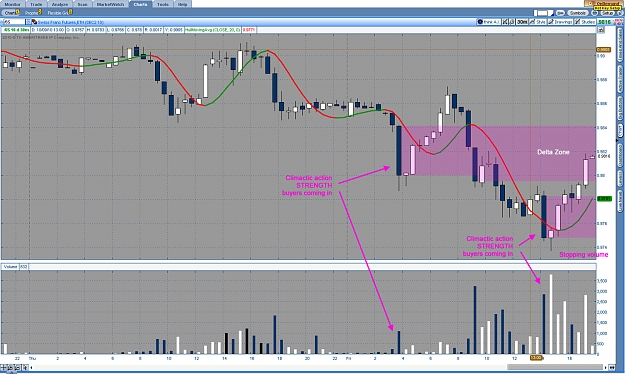
Is it just the scaling of different charts or is it really easier to spot VSA setups on futures? All significant points (two stopping vols + test) are staring right at your face, rather than having to guesstimate from mt4 vol...
vsa with Malcolm
- hsa013 replied Sep 8, 2010
I'm posting mistakes rather than successful trades because I can learn more of those
vsa with Malcolm Yesterday evening I was about to sell into a classic ND situation but something stopped me - although it would've been a good decision in hindsight. See attached ...
- hsa013 replied Sep 6, 2010
Hello trade2live, No, I missed it, sorry... here you go. Two versions, one with HLC bars + the other with candlesticks. I like the HLC more nowadays. (The bottom indi window is just for Fx market hours)
vsa with Malcolm
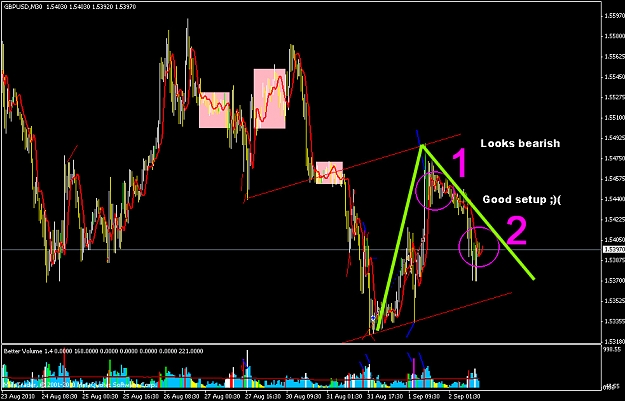
- hsa013 replied Sep 5, 2010
Petar, Thanks a lot for your explanations. However, I think we might be talking about two different entry points. See attached chart: Are you talking about entry (and bearish scenario) at No.1 or No.2? In case of No.1 I absolutely see what you mean, ...
vsa with Malcolm
- hsa013 replied Aug 25, 2010
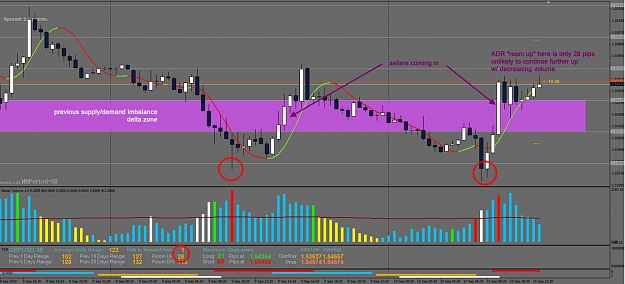
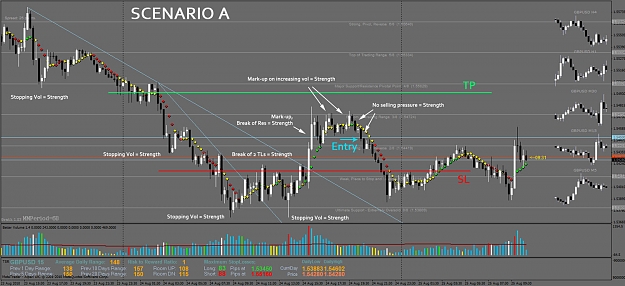
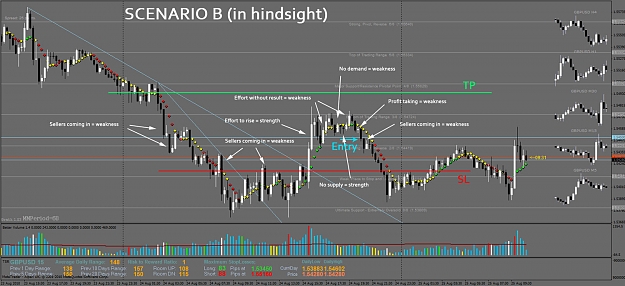
GU setup from yesterday — OK chaps, here we go. What did I do wrong? This is a GU chart from yesterday. I did my analysis according to "Scenario A", which showed strength almost everywhere in the background. I thought after two stopping ...
vsa with Malcolm
- hsa013 replied Mar 23, 2009
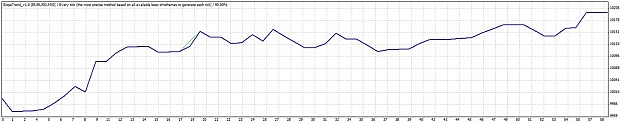
Results for EUR-USD 3/02/09 - 3/21/09 Time Frame: 30 Minutes FastSlopePeriod: 13 SlowSlopePeriod: 21 Filter: SSF Stop Loss: 14 Trailing Stop: 25 (same results fro 0-50) Break Even at Profit: 8 Take Profit: 69 Total net profit 197.80 Gross profit ...
Slope Trend EA Thread......
- hsa013 replied Mar 19, 2009
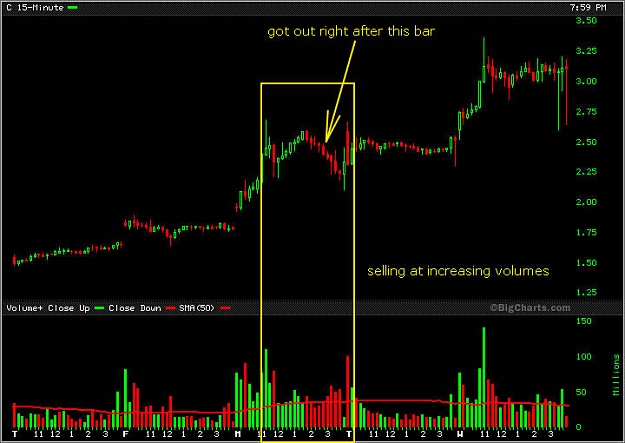
guys, thank you for your response! Attached another image which shows exactly which bar I got out after. The problem was that I didn't have too much time to analyse, nor did I have any decent charting package at hand (I was at work, quite busy) so I ...
Learn to Trade using VSA (Volume Spread Analysis)
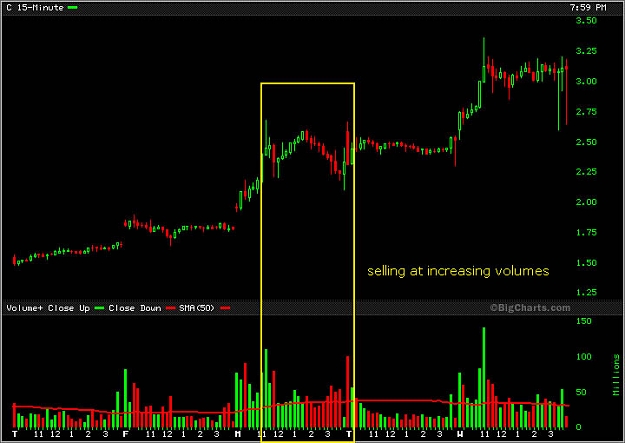
- hsa013 replied Mar 19, 2009
good morning, here's a question: what could have I done better on Monday? Attached is an image showing Citibank's price index I was analyzing with VSA, trying to find a point for exit - this was live, btw. I know it's not Forex, but it's a classic ...
Learn to Trade using VSA (Volume Spread Analysis)
- hsa013 replied Mar 16, 2009
very impressive! — Ladies and gentlemen, I've been pointed towards this thread a couple of weeks ago by a member here, but only now had time to start understanding how it works. First of all, thank you Nyse and all others for the contribution, ...
Learn to Trade using VSA (Volume Spread Analysis)
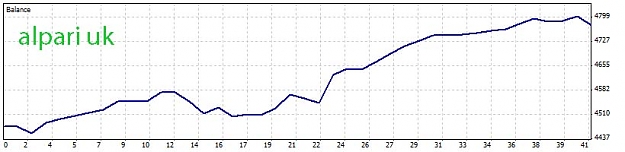
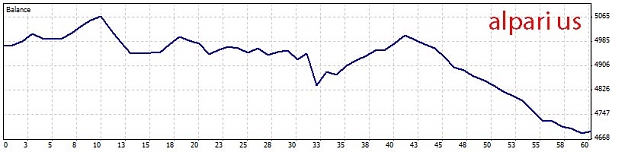
- hsa013 replied Mar 3, 2009
what the hell... — Today was interesting indeed. Take this: Two brokers, same charts, same settings, same EA, same day. Alpari UK: +$300 Alpari US: -$278 That's almost $600 as in six hundred dollars difference!! Bloody hell... One could think: ...
Slingshot 30M & 1H - The 2nd Coming......
- hsa013 replied Feb 26, 2009
Yes, you have Gary! They would behave similar to the little arrows, marking the start of a trade. But with this we would instantly see without having to look at multiple logs which filter traded and when. Probably useful for posting screenshots, ...
Slingshot 30M & 1H - The 2nd Coming......

- hsa013 replied Feb 26, 2009
labelling filters — Dear programmers I was wondering whether it would be possible to put "labels" or "markers" on the chart according to the filters traded. I don't know if the arrows and little SL and TP lines are automatic by MT4 or it is in ...
Slingshot 30M & 1H - The 2nd Coming......
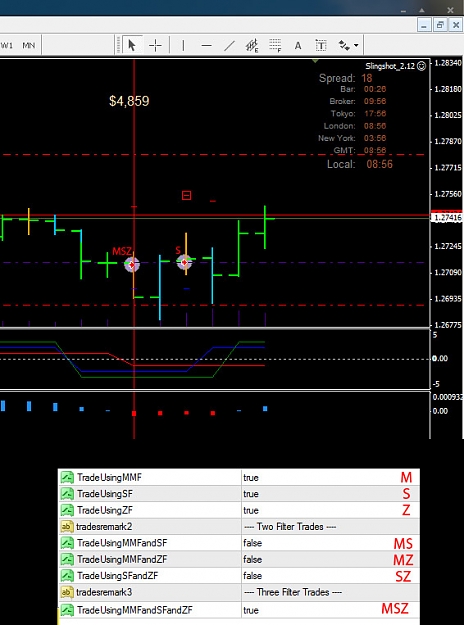
- hsa013 replied Feb 15, 2009
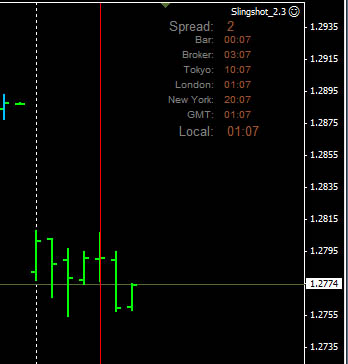
clock indi — hi all, I thought I could share this simple but useful tool. It's a little clock sitting in the corner, showing current spread, local and broker times and main timezones. it helps decide what to put into EA for GMT offset. Gary, ...
Slingshot 30M & 1H - The 2nd Coming......
- Posts by Member Search: 'hsa013'