- Search Crypto Craft
- 152 Results
-
 hostwey replied Aug 17, 2023
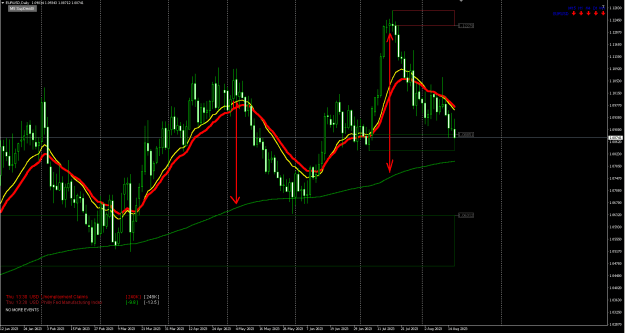
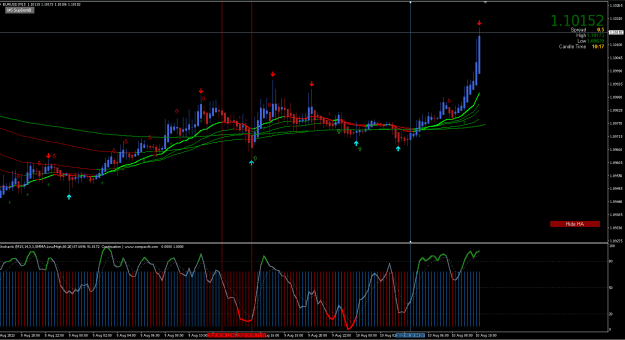
EURUSD Daily almost back to the 200MA. Not a huge loss from theta (rising MA) after its little excursion. Around 100 pips, assuming it continues on its merry way! image
A Simple Mean Reversion Strategy
- hostwey replied Aug 16, 2023
The only issue I've had is that it only ranges between 43 and 55 etc. If that matters? Other than that a very nice indicator. image
M1 Countertrend Scalping Strategy
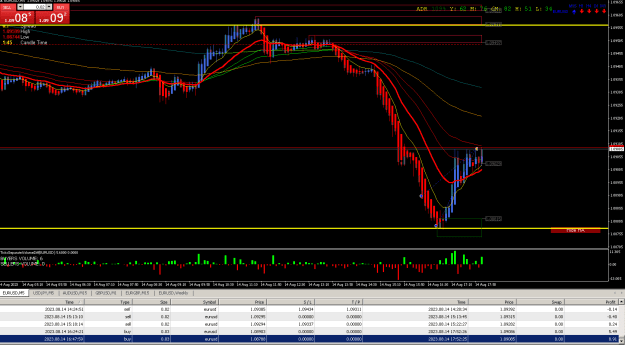
- hostwey replied Aug 14, 2023
Eurusd trade. Had to trade this on limit orders as I had to go out. Were I able to manage the trade, would have been 0.10 lot size. On limits I tend to get in too early. image
M1 Countertrend Scalping Strategy
- hostwey replied Aug 10, 2023
Here they are. Got them all of this forum I think. image
M1 Countertrend Scalping Strategy
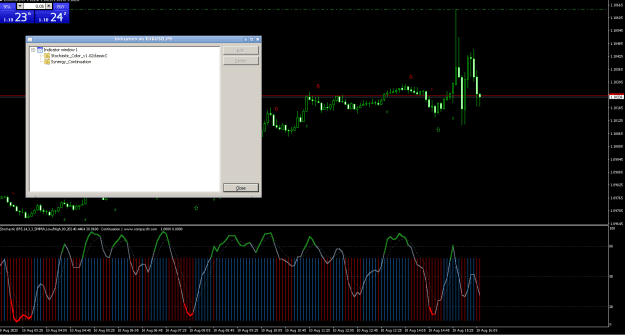
- hostwey replied Aug 10, 2023
Similar setup using Stochastics and the synergy continuation indicator. image RSI Div indicator with synergy continuation. Its all the same data really, all based on price action obviously.
M1 Countertrend Scalping Strategy
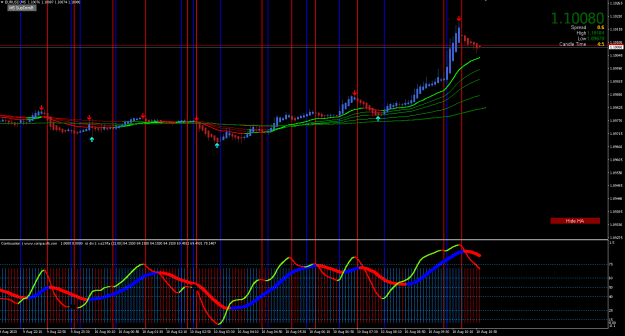
- hostwey replied Aug 9, 2023
You can find VolumeMA in standard MT4 install I think, or just volume and 20 EMA into the indicator. I find TickSeperateVolumeDif more visually useful though. That can be found in the files paperclip above. image Bear in mind this is just tick ...
M1 Countertrend Scalping Strategy
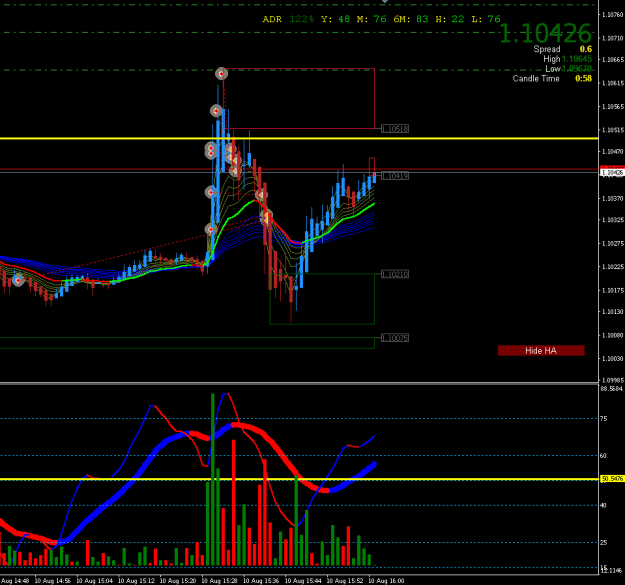
- hostwey replied Aug 6, 2023
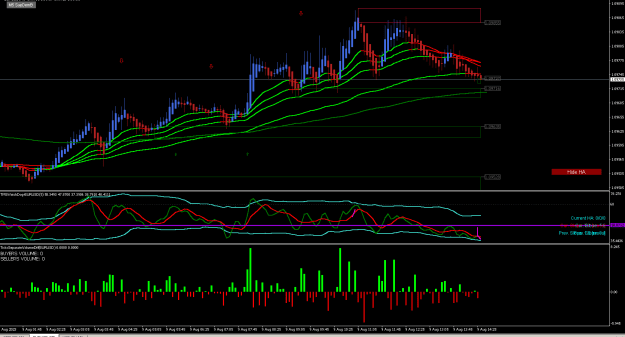
Sorry about that cpfleger. Its basically your (synergy?) template I think, so APB candles for the MT5 platform. Think I've just added some supply/demand zones. Here is the 15 minute chart. A nice double bottom formed into the demand area, so was ...
M1 Countertrend Scalping Strategy
- hostwey replied Aug 6, 2023
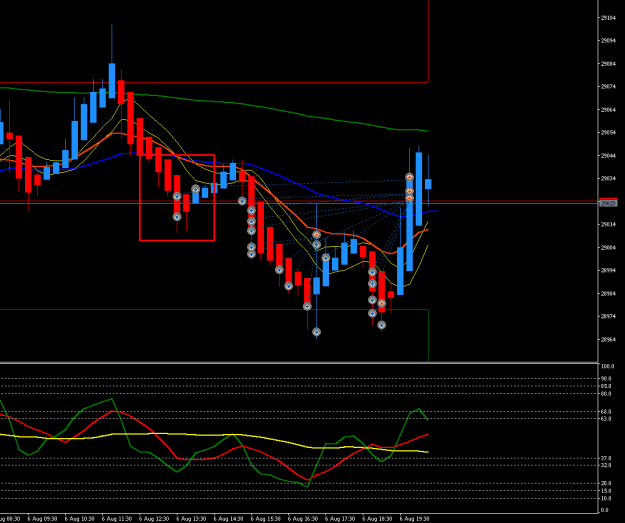
BTCUSD. A small 1 minute kof scalp in the red rectangle area turned into a major drama as I got distracted and it fell back on me. Averaging in saved the day! image
M1 Countertrend Scalping Strategy
- hostwey replied Aug 6, 2023
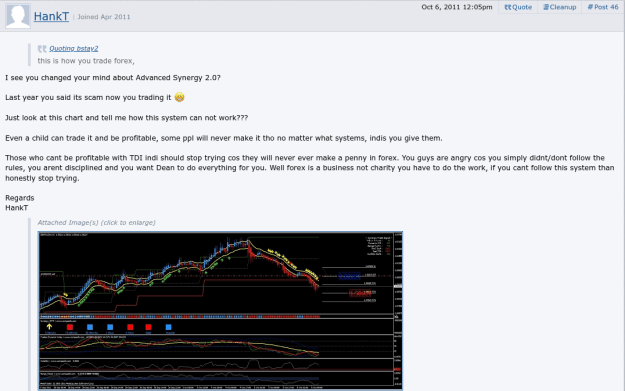
Screenshot of an old forum post, but still valid I think
My Synergy Strategy
- hostwey replied Aug 5, 2023
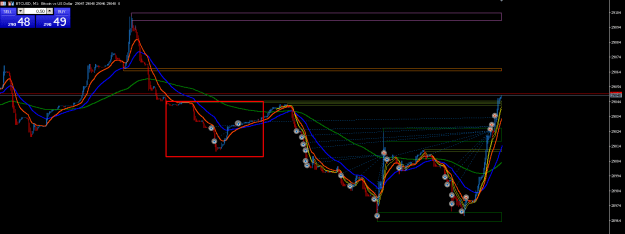
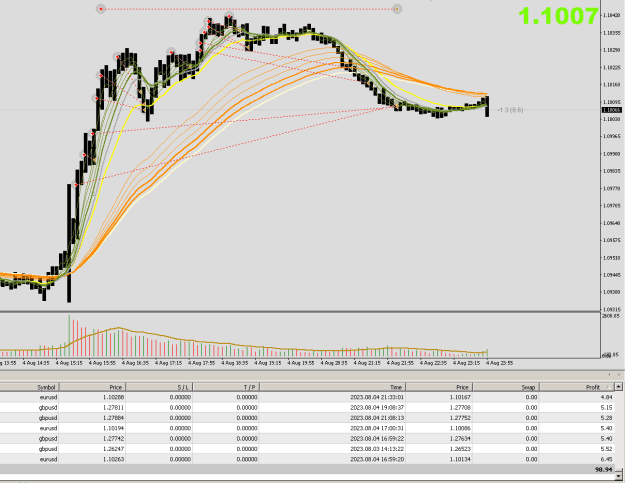
You were lucky. I ended up fading the entire move up by the EURUSD (as well as GBPUSD). One was enough. And then the stupid thing decided to stay up there, with some kind of bull flag thing going on. Thankfully averaging in and a small retracement ...
M1 Countertrend Scalping Strategy
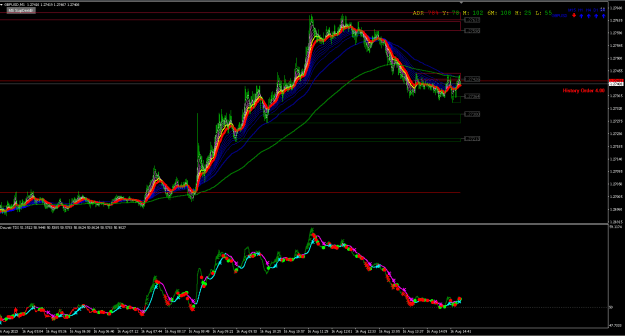
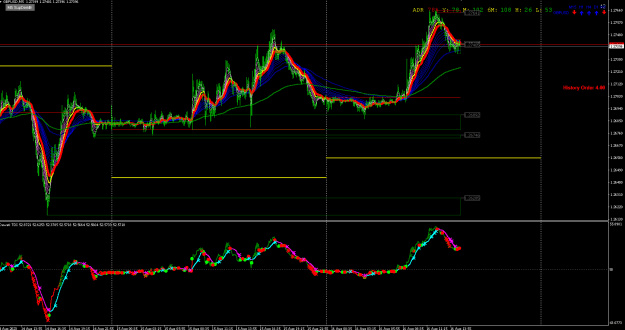
- hostwey replied Aug 1, 2023
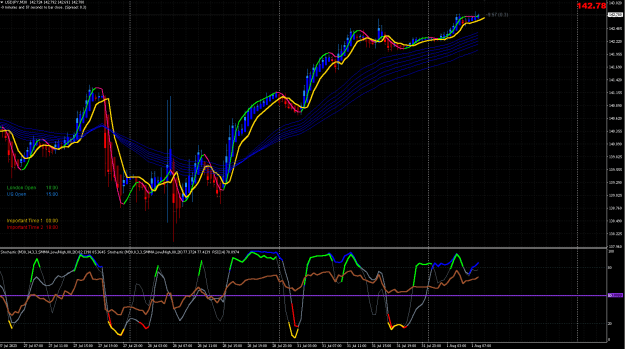
All I did was add a long term Guppy Multiple Moving Average to your system. Even then not a perfect solution. The setups on a daily will be very few. As always with trading it requires almost a leap of faith and weighing up a field of probabilities! ...
Trading Made Simple(r)
- hostwey replied Jun 30, 2016
I think I tried the MT4 cumulative delta indicator a while ago. I don't think it is wise to rely on tick volume. The results seems to vary from broker. I could also be subject to manipulation by a broker (not saying it is, but it could be). If you ...
Institutional Equivalent Education?
- hostwey replied Apr 10, 2015
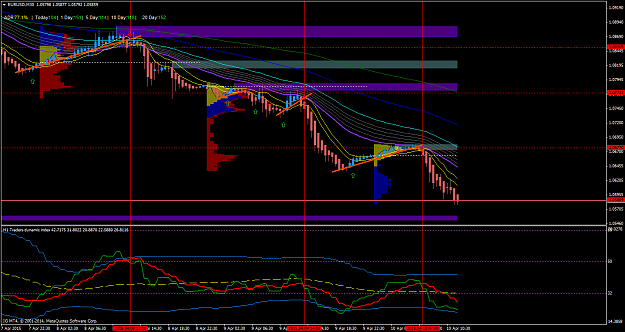
Good luck with the new thread. Have subscribed. Interesting how the H1 TDI cross has called these drops in EURUSD (just ignore trades or crosses against the slow Guppy). image
TMS for M30 charts
- hostwey replied Oct 28, 2014
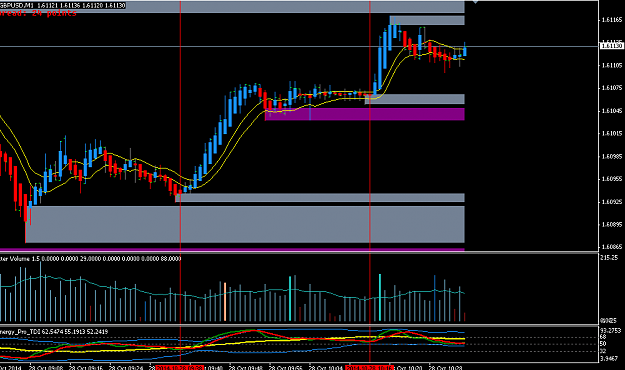
None at all for those of us prepared to get stuck in on the M1 chart (yes the M1 chart!). We can see responsive buyers stepping in and liquidity building below and 13+ so pips with nice momentum candles on the pullback into demand. image
Trading Made Simple
- hostwey replied Oct 28, 2014
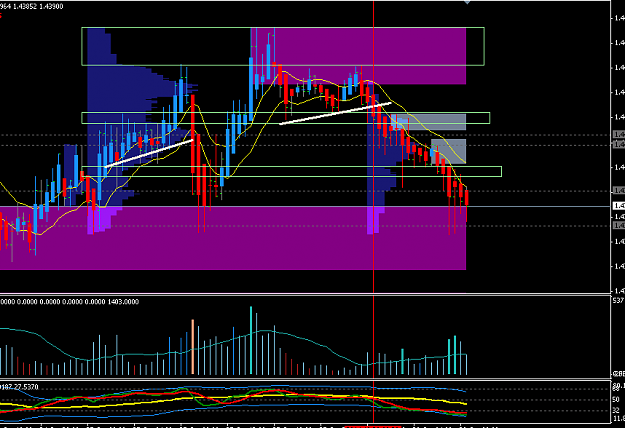
Wonder if phx62 captured this move on Euro Aussie. I didn't was asleep! image Where are players likely to have their stops? Either side of high volume nodes. When price is gradually rising, liquidity will be build in the form of stops to the ...
Trading Made Simple
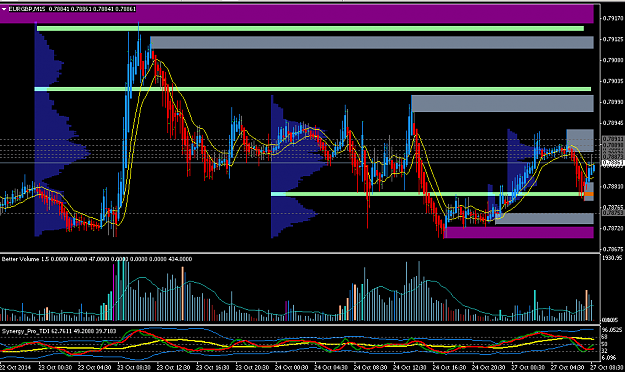
- hostwey replied Oct 27, 2014
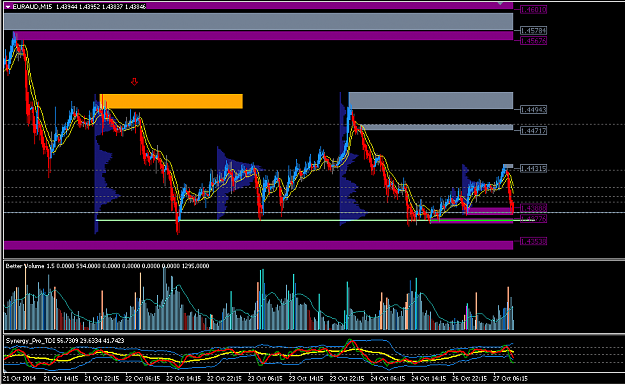
Yes here is EURAUD M15 and I have a lime green line which has been acting as a floor on EURAUD over the past few days excepting a few false breaks below it (simply no volume below - no buyers or sellers). My feeling is that institutions will be ...
Trading Made Simple
- hostwey replied Oct 27, 2014
Well I'm not an expert on MP by any means. Hopefully another tool in the armoury, but there is a correlation between low volume area's of the chart and supply and demand which will 'frame' the market in the short term, obviously as price reaches an ...
Trading Made Simple
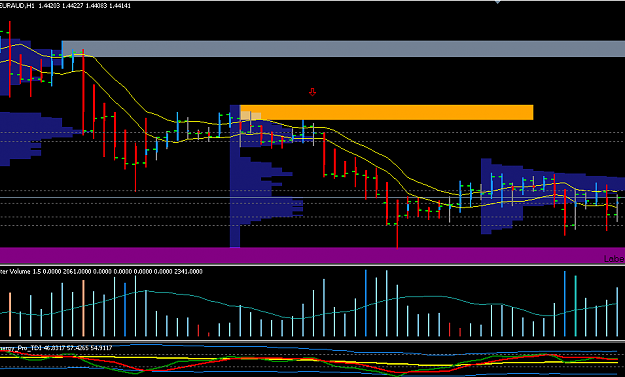
- hostwey replied Oct 27, 2014
You were basically trading into supply above. Your bias on these areas of the charts needs to be short. Also from a market profile aspect, the orange area would represent a 'low volume node.' What I've started doing is start projecting low volume ...
Trading Made Simple
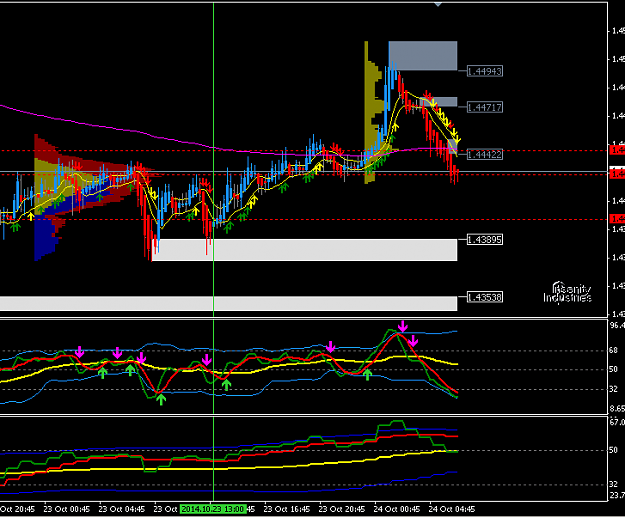
- hostwey replied Oct 24, 2014
Great trade as always omonisha On the short time frame chart that is the pullback into demand I mentioned a few posts backs. Wait for 'fresh' demand and then the pullback. image
Trading Made Simple