- Search Crypto Craft
- 24 Results
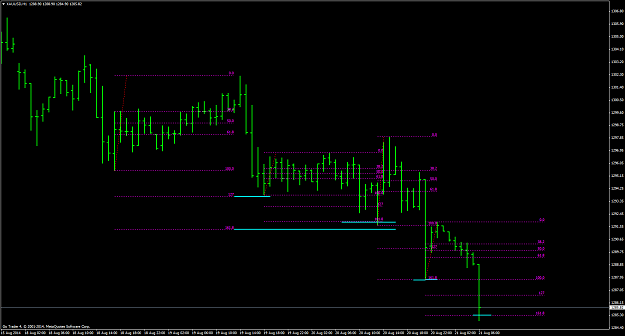
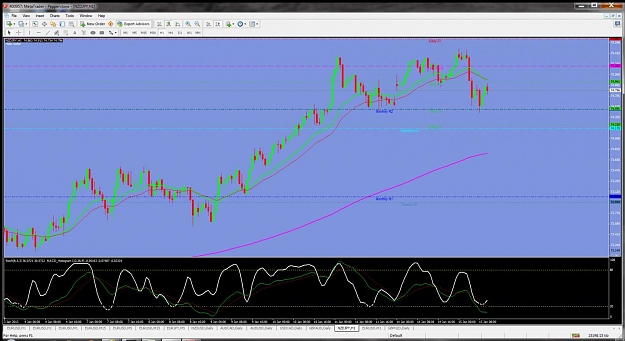
- gregben replied Aug 29, 2014
Was going back through my charts ( I have 2 live accounts with Pepperstone and Go Markets) and noticed the huge difference with price on the spike down at 1:00 on the 28/8. Both charts attached. The spike down on 22/8 at 17:00 were the same at 1274 ...
Only Gold!
- gregben replied Aug 20, 2014
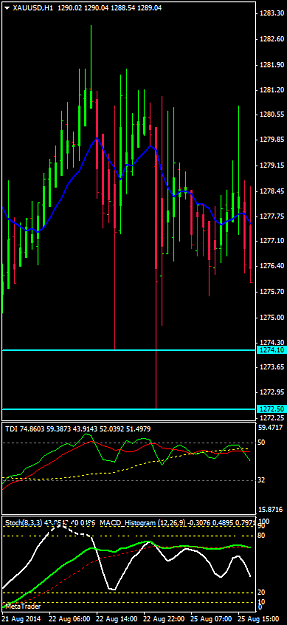
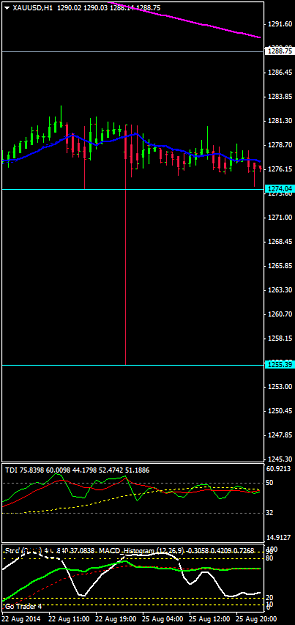
We may now see a retrace from the low at 84.90 as we have met the 161.18 extension of the last move up on the H1 chart. For the last few days the 127 and 161.18 extensions have worked to perfection. See attached chart showing same.
Only Gold!
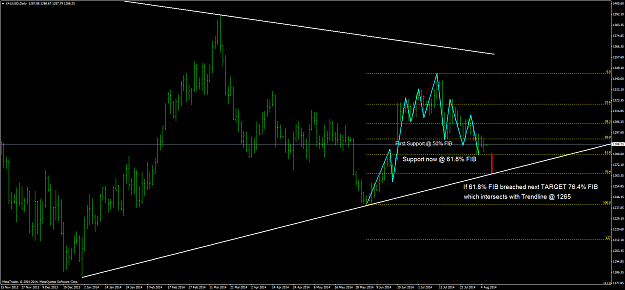
- gregben replied Aug 5, 2014
Subject to Geopolitical forces dominating the market, I see a further fall to the 1265 region. The Silver daily chart is extremely bearish and should pull Gold down with it. The attached chart shows my analysis. Smaller timeframes show potential for ...
Only Gold!

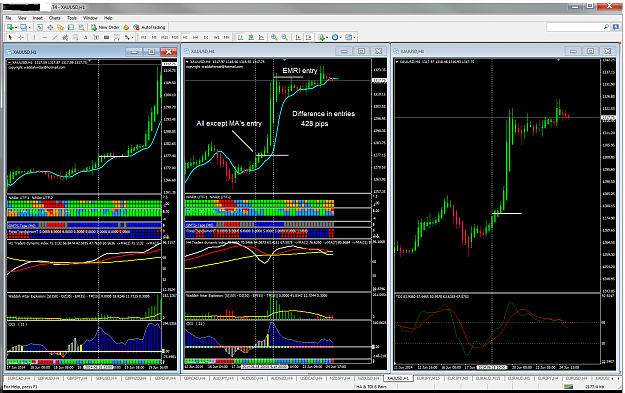
- gregben replied Jun 24, 2014
Eitan and Vigovski, Thankyou both for the effort and work you have put into developing this system and sharing it with us. The following is not a criticism of your hard work, but I was wondering if you could comment on the chart I have posted. Left ...
Eitan's Project
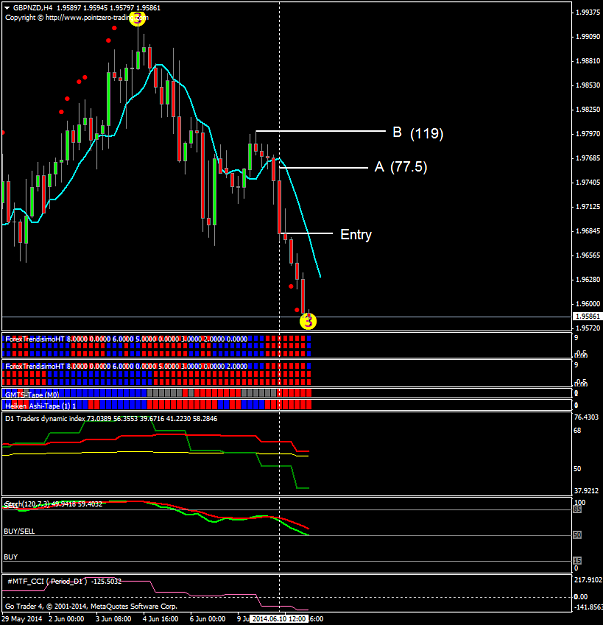
- gregben replied Jun 11, 2014
Hello Eitan, I am fairly new to this thread and am impressed with what I have seen so far, congratulations. As yet I have not placed any trades with your system, but intend to in due course. My question is relating to the best place to put your SL ...
Eitan's Project
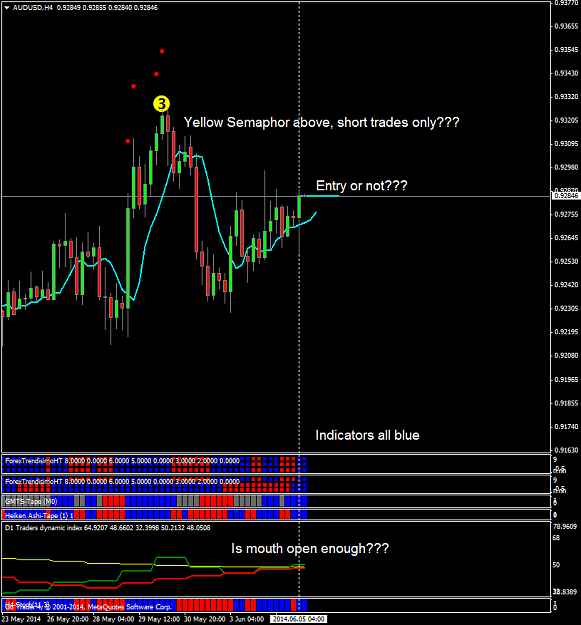
- gregben replied Jun 5, 2014
Eitan, I have recently come across your thread and find it most interesting. Congratulations. Although I have been a scalper all my time as a forex trader, I am interested in attempting a longer time frame system to compliment my scalping strategy. ...
Eitan's Project
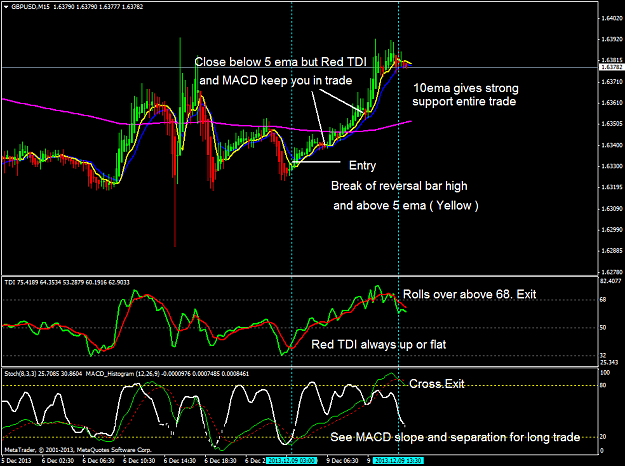
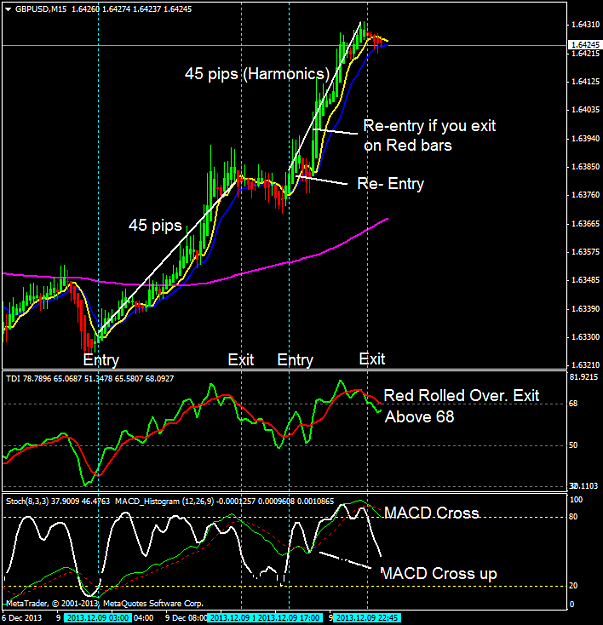
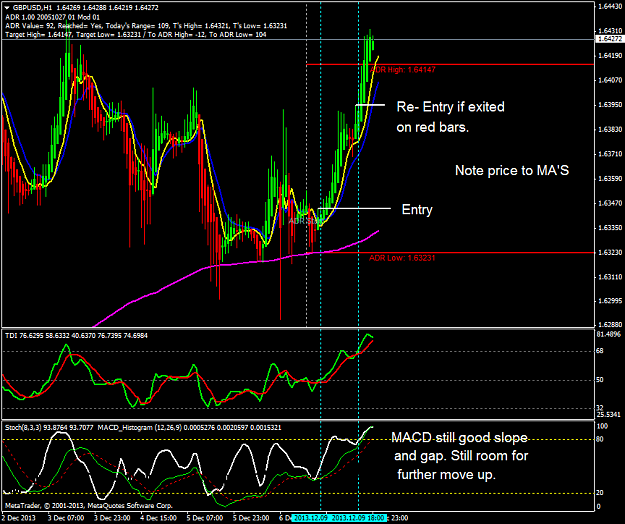
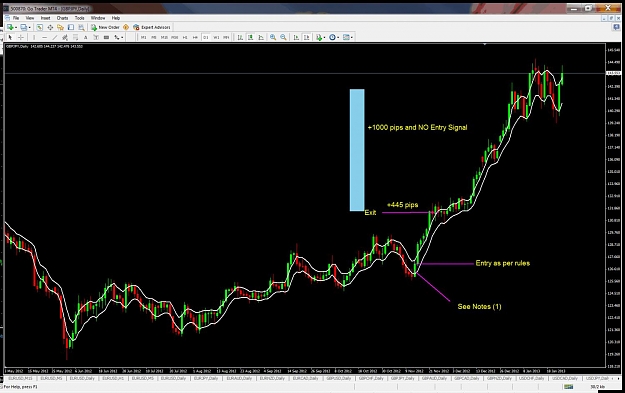
- gregben replied Dec 9, 2013
Hi Fellow Traders, Let me begin by saying I think the thread should be called “Trading Made Simpler”, because I have found over 8 years of trading that there is nothing simple when it comes to forex. My trading results are not where I want them to ...
Trading Made Simple
- gregben replied Feb 3, 2013
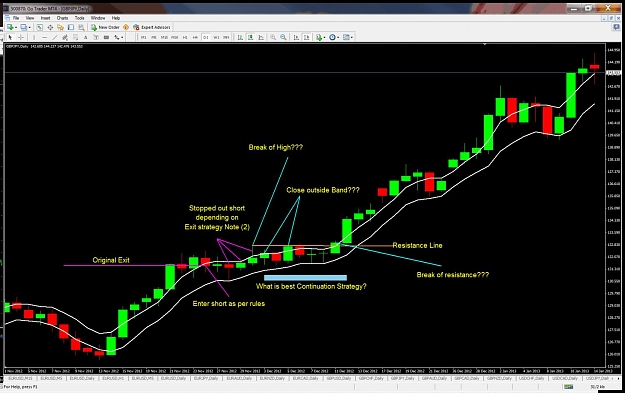
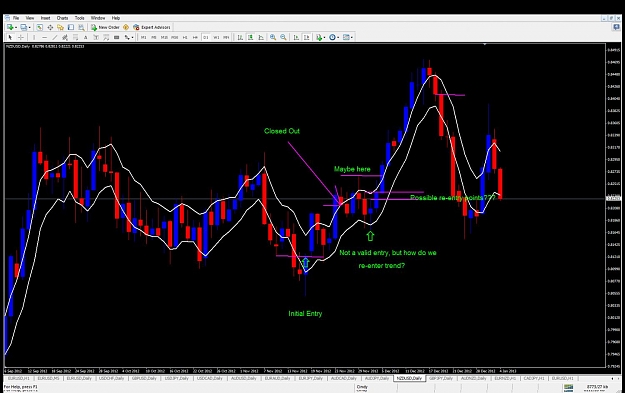
Silat50, Re: Continuation entries. See below part of email sent to Paul in late Jan which relates to your latest post The biggest deficiency as I see, and you have posted on this, is after getting stopped out of a trade you get a continuation of the ...
The7 Trading System
- gregben replied Jan 15, 2013
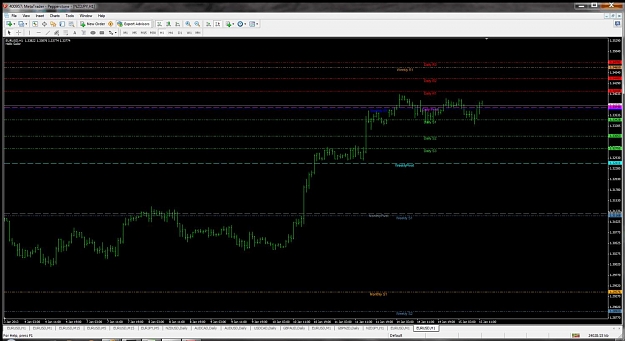
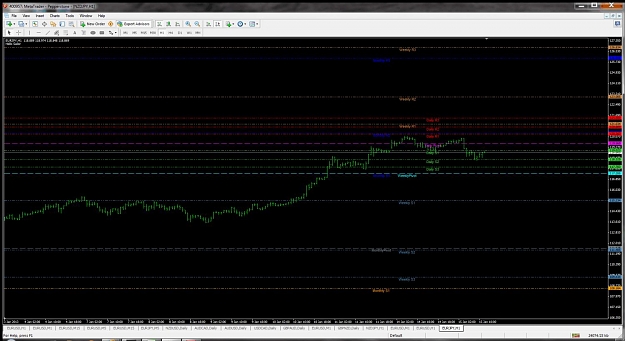
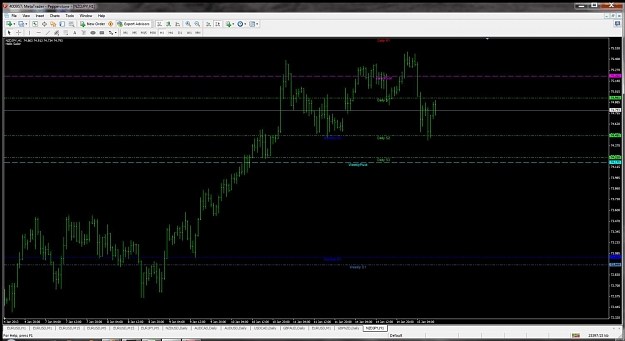
See EU and EJ charts of pivots. The indicator shows all Hourly, Daily and Monthly Pivot and S & R levels I have attached indicator
The7 Trading Method Signals Thread
- gregben replied Jan 15, 2013
Silat50, See chart with AutoPivotIndicator_ver5 on it. You will see at the point you indicated, that it coincided with the MonthlyR2 and DailyS2 on my chart, giving it I guess power at that point. Also you will see that this level also held the ...
The7 Trading Method Signals Thread
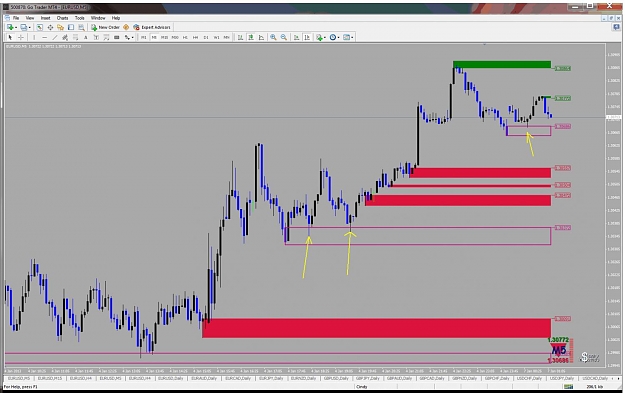
- gregben replied Jan 6, 2013
Paul, The boxes that are not coloured in are one's that have rejected price more than once. See attached chart as an example on a 5 min chart. As the thread is for daily trading only, and I have only been using this indicator for a short period, I ...
The7 Trading System
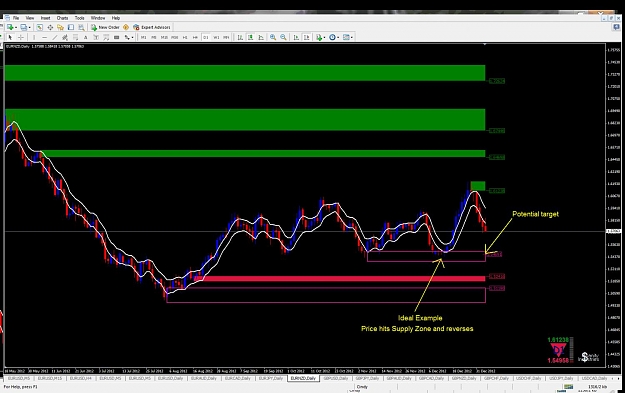
- gregben replied Jan 5, 2013
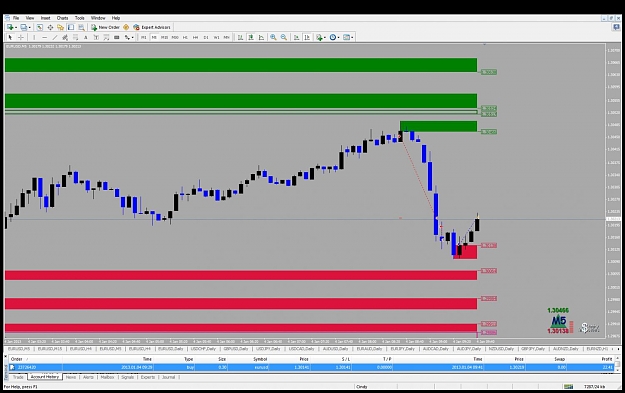
Silat50, This chart gives an example of a Demand Zone reversing price and also showing potential target. gregben
The7 Trading System
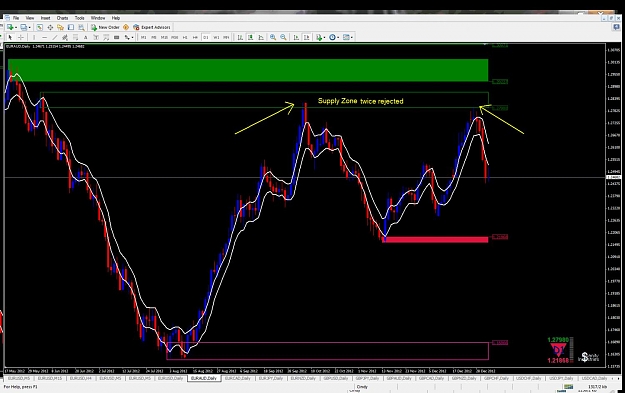
- gregben replied Jan 5, 2013
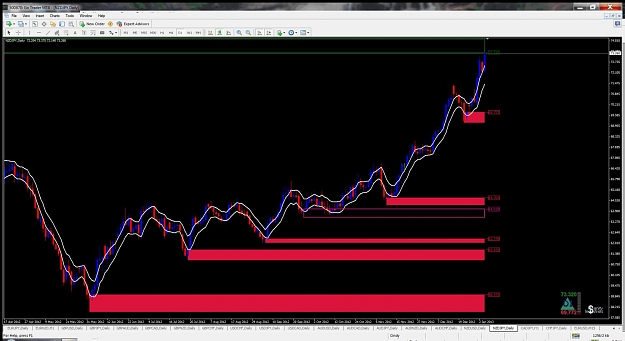
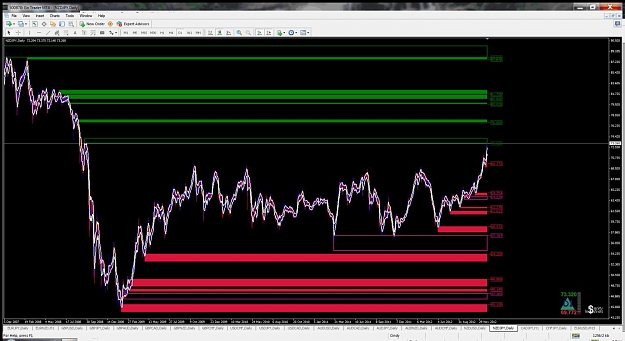
Silat50 See charts showing supply and demand levels. I picked this one to show you as price is about to enter a supply zone formed way back in Sept 2008. I have included a compressed chart to show this. Theoritically it should provide resistance and ...
The7 Trading System
- gregben replied Jan 4, 2013
Silat 50 I have been monitoring this forum since mid Dec and am very impressed with it's simplicity. Although not trading any signals yet I have been monitoring about 15 pairs. The problem I see is not the entry, that is staight forward, but the ...
The7 Trading System
- gregben replied Jan 4, 2013
See chart for first 3 trades of the day, 2 short for +23 and +4 and a buy for +8. gregben
C-12's Supply, Demand and PA thread
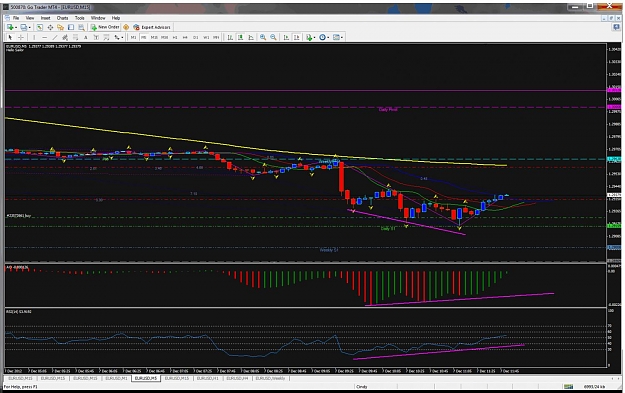
- gregben replied Dec 7, 2012
Divergence. Entered this trade as a specky purely based on divergence. See chart showing divergence on RSI ( over sold area ) and AO compared to price. Also price was at the Daily S1 level. I have 13 pips locked in and will continue to move stop iu ...
The Student Handbook
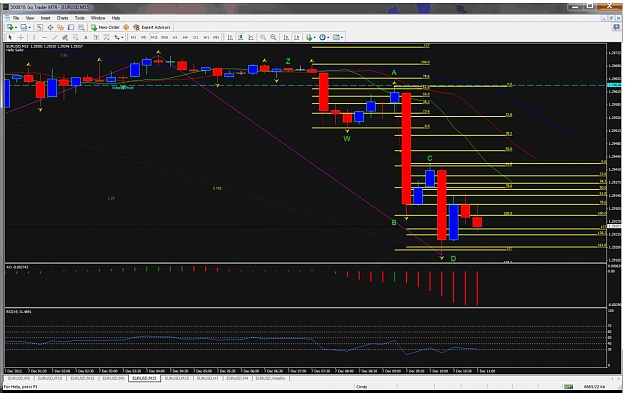
- gregben replied Dec 7, 2012
Guys, A couple of you have been asking where to exit trades. A rule I have been following is to target 127% of the AB leg and / or the 161.8% move of the BC leg. See the attached chart of the 5 min and you will see it was a perfect place to exit. ...
The Student Handbook