- Search Crypto Craft
- 95 Results
-
 goodtiding5 replied Nov 13, 2016
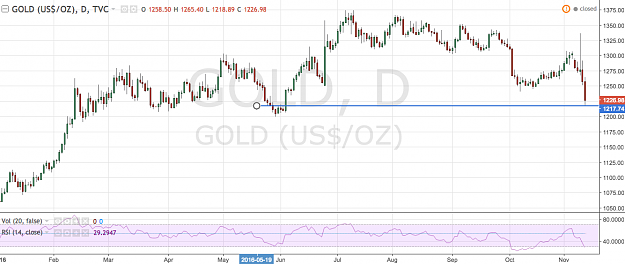
Did gold hit daily supply zone? image
Price action trading - Trade like the pros!
- goodtiding5 replied Nov 9, 2016
Election day madness :-)
Price action trading - Trade like the pros!
- goodtiding5 replied Dec 5, 2014
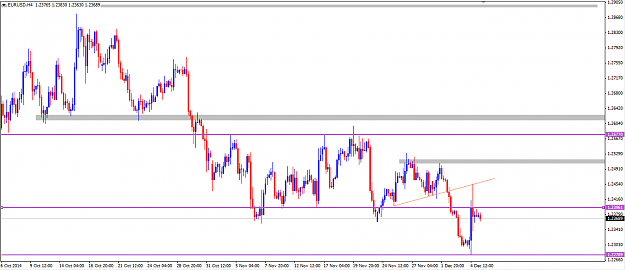
Fader, After you looked at this 4H chart, do you still want to long EURO? Sorry for being harsh
Keroro0o0o's S&D + PA trading image
image
- goodtiding5 replied Feb 4, 2014
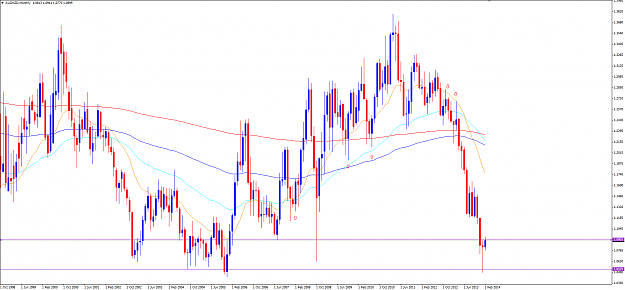
Zoom out on the monthly chart, search for september 04 monthly bar, that's a good resistance reference. image
Strat's Long Term Stress Free Trading
- goodtiding5 replied Oct 15, 2012
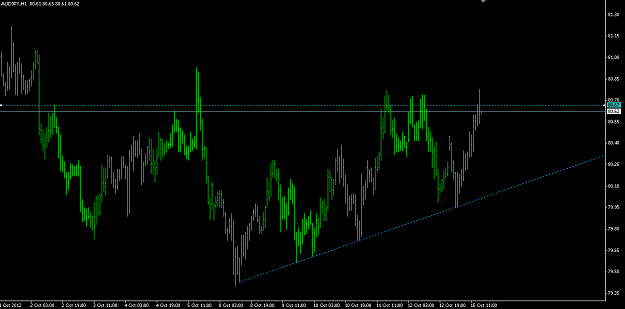
Watch AUD/JPY — AUD/JPY, overhead resistance at 80.67. Can we break to the upside? Ken
Fail Better
- goodtiding5 replied Sep 25, 2012
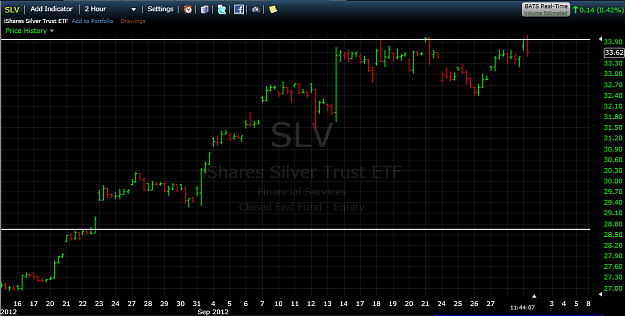
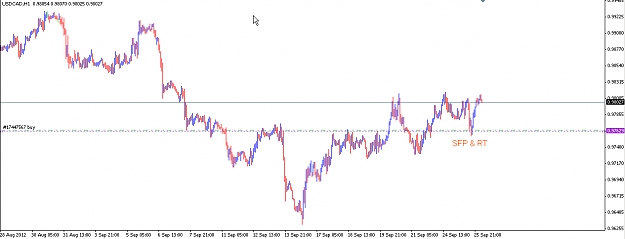
SFP & Rounded test — First demo trade on SFP and Rounded Test. Ken
Fail Better
- goodtiding5 replied Sep 21, 2012
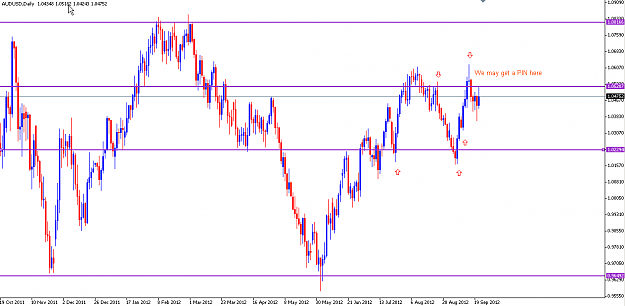
Signals on PPZ — Some of the PA signals on the daily AUD/USD chart. Signals on PPZ is lethal :-)
james16 Chart Thread
- goodtiding5 replied Jul 13, 2012
Gold — We may get our designed signal today and then trade on Mike's breakout method
james16 Chart Thread Ken
- goodtiding5 replied Feb 6, 2012
USD/CHF daily PIN — Daily USD/CHF, long term EMA (365), BRN 0.9200, PIN, going with current trend direction.
james16 Chart Thread
- goodtiding5 replied Oct 30, 2009
A Rac style trade on UC. It's based on 1Hr chart. Ken
james16 Chart Thread

- goodtiding5 replied Oct 26, 2009
Here is a pattern that I have been following and I hope it will be the helpful to others. Let's take the recent USD/CHF daily chart. On spot #1, we noticed something like a reversed PIN. In japanese candle stick language, it's called tombstone ...
james16 Chart Thread
- goodtiding5 replied Oct 14, 2009
EUR/CAD weekly chart. It looks as if the price has formed the apparent "Head and Shoulder" pattern. The neck line is around 1.5400. Watch PA around 1.5400.
james16 Chart Thread

- goodtiding5 replied Oct 13, 2009
E/G — Daily E/G chart. A daily PIN on the top. Price got rejected at 0.94. Last time it was rejected at 0.93 and went on. Divergence on the MACD histogram. It ran too far and too fast from the long term EMA's. Retracement is overdue. It would ...
james16 Chart Thread

- goodtiding5 replied Oct 13, 2009
GJ 4H. Price tries to move higher. Can it break the EMA(60) and trend line? Price action will give us clue.
james16 Chart Thread
- goodtiding5 replied Oct 13, 2009
Daily GJ. Long tails from the weekly pivot zone indicates strong rejection. However, a down trend line is hang over the top. Price is making a wedge here. If the price can break above the trend line, we will see upside movement. If price breaks the ...
james16 Chart Thread

- goodtiding5 replied Oct 13, 2009
Hi Jarroo! For the GJ, let's start with this weekly one!
james16 Chart Thread
- goodtiding5 replied Sep 2, 2009
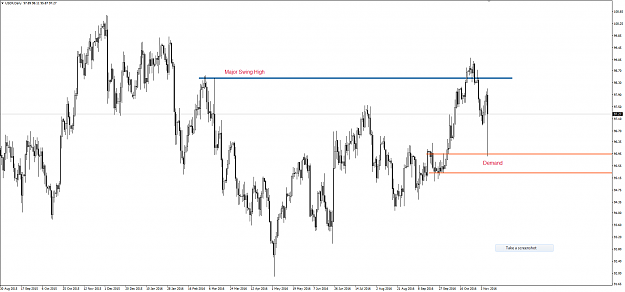
USDCAD — Hi Strat! I have been studying your method and here is a setup I think is good. We have had a hammer on the weekly around the Major resistance turned support. And then, on the daily, we have a BUOB on the minor S/R. I think we could ...
Strat's Long Term Stress Free Trading


- goodtiding5 replied Jul 21, 2009
This is not totally James16, but after the three white knights formation off the weekly PPZ, now we see anther rising three method on the GJ daily chart. All this tells me that we may have more upside potential for GJ here. I will be looking for ...
james16 Chart Thread

- goodtiding5 replied Jul 21, 2009
UJ — We had a UJ pin around 94 area. I choose to pass for the following reason: We have a divergence on the price and MACD histogram, which implies that there is bullish momentum behind the UJ price for now; and There is a much stronger PPZ ...
james16 Chart Thread