- Search Crypto Craft
- 21 Results
-
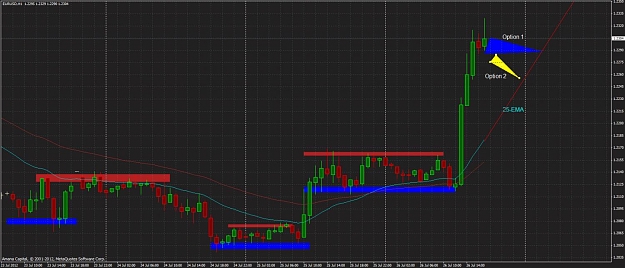
 fxanonymous replied Jul 31, 2012
if the upmove wasnt so damn fundamentally backed then that would have been one juicy head and shoulder on the H4
EurAnalysis
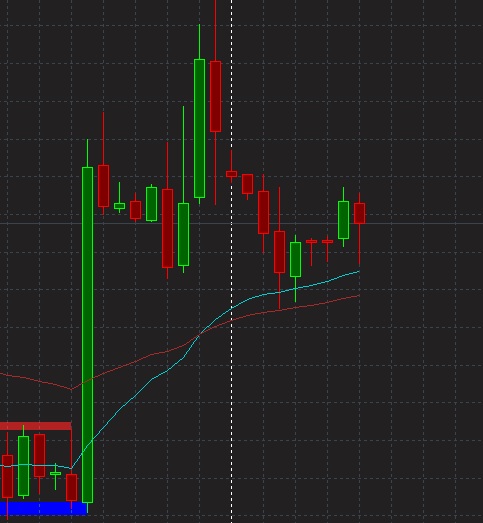
- fxanonymous replied Jul 26, 2012
PA on the H1 chart shows declining momentum for buyers. The question is whether price will start slowly going back down or range for the rest of the day. Ongoing battle what do you think?
EurAnalysis

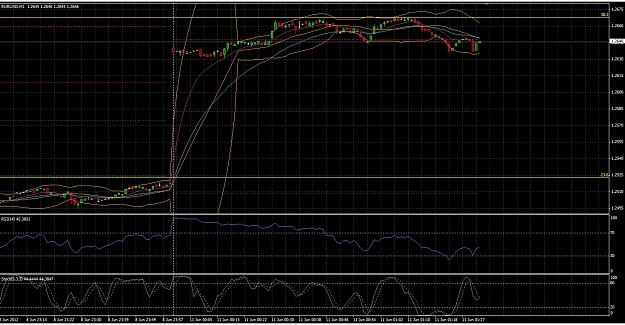
- fxanonymous replied Jun 10, 2012
sooo here's what i think: price has shifted during the weekend from its resistance on the 23.6 to the 38.2 (using fibonacci on the drop from may 1 to june 1) it also seems to have gone back under the R2 from the daily pivot point and using it as ...
EURUSD
- fxanonymous replied Jun 4, 2012
got my 15 pips** just as i forecasted. I waited for the price to reach the 25-EMA on the 5min chart and it bounced back as i said. got 15 pips. maybe not 20 pips, but better than nothing. I could've kept it open and wait for 20 pips but in a hurry ...
EURUSD
- fxanonymous replied Jun 4, 2012
i have 2510-2520 as a signal too... but the 5min chart is BEGGING for a retracement to the 25-EMA I think once it hits this EMA it will bounce all the way up to 2500-2510 range... as for me, well i just want my 20pips..
EURUSD
- fxanonymous replied May 31, 2012
1H candle getting very close to 25-EMA, price could bounce back down for the second half of the day. but too much news to rely only on technicals...
EURUSD
- fxanonymous replied May 25, 2012
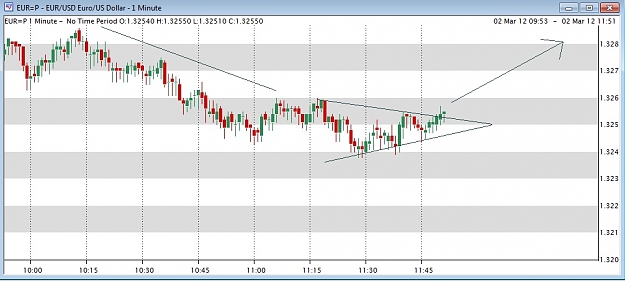
yep and now we should prepare to enter a downward move. descending triangle forming in 1min and 5min chart (see below). shorting at 2585 would be good. expecting a breakout to the downside in the next 15minutes.
EURUSD
- fxanonymous replied May 25, 2012
oh ok i got it! thanks! anyway, goodmorning everybody today. i'm checking out the 1H chart and price is about to touch the 50-EMA. If it breaks 1.2585-1.2590 then it it will become a bull day with these levels becoming the new support. otherwise we ...
EURUSD
- fxanonymous replied May 23, 2012
exciting day. a break below the 1.2640's would trigger a selloff to the low of 2010 within a matter of weeks! 1.1876 ?!
EURUSD
- fxanonymous replied Mar 1, 2012
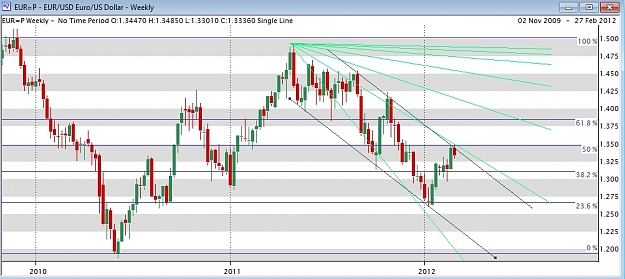
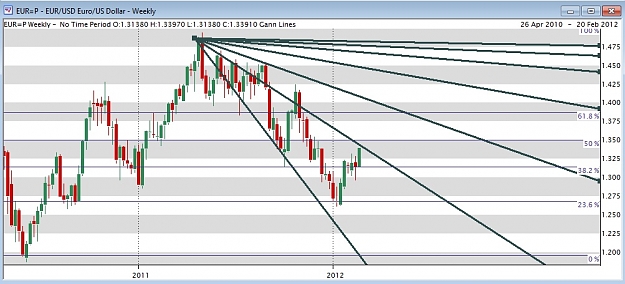
weekly chart: fibonacci and gann and channel: all indicate the resistance was hit this week and is dropping to the next support level of AT LEAST 1.3115 in the next week or two. it looks too easy. but not sure if it should be.
EURUSD
- fxanonymous replied Feb 29, 2012
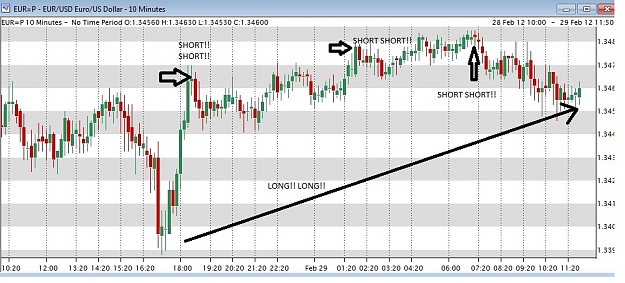
this is what i mean also keep in mind, nobody can predict the future
EURUSD
- fxanonymous replied Feb 27, 2012
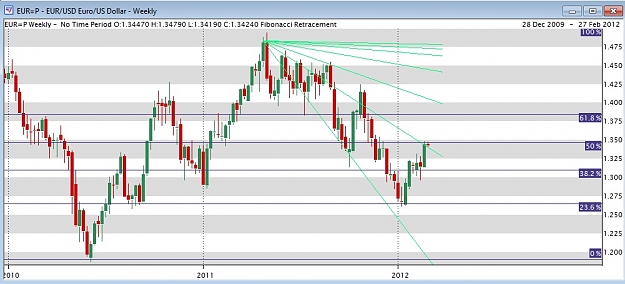
weekly chart showing hitting gann and fibo resistance. next candlestick (this next week) should be very red. Otherwise could go all the way up to 1.37xx in the coming month... fundies and news will decide.
EURUSD
- fxanonymous replied Feb 24, 2012
Since I'm so confused about the direction, I have chosen to stay out for a while and I have taken the time to read up on some new technical methods. Today: Gann Angles. I've tried applying what I learned on the Gann angles to the weekly chart (they ...
EURUSD
- fxanonymous replied Feb 23, 2012
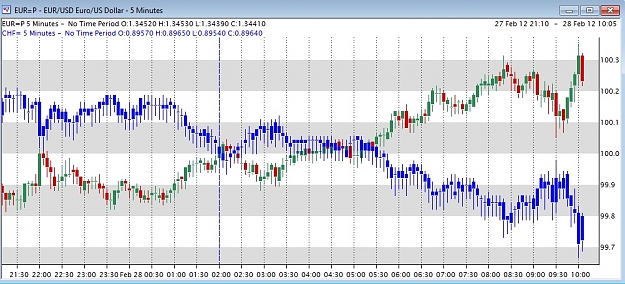
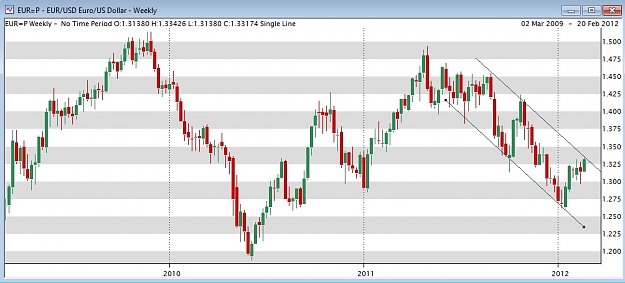
the last month 1.5 to 2 months could just as well be the correction of the weekly chart. The euro zone is not doing any better. don't forget portugal italy and spain... and of course GREECE! look...
EURUSD
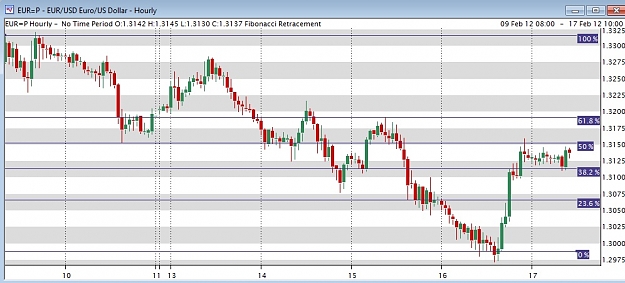
- fxanonymous replied Feb 17, 2012
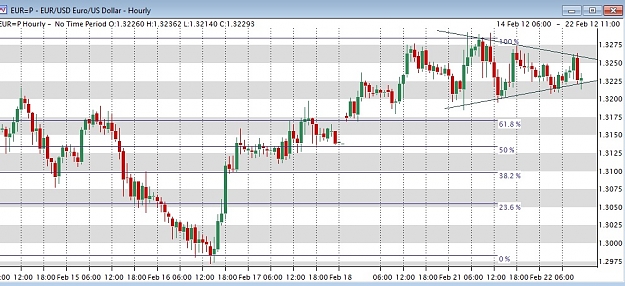
i've been reading up on fibonacci retracements for the first time... from what I understood, by looking at the hourly chart, if eurusd goes over 1.3150 then it should go all the way up to around 1.3185 and it will become the new resistance... the ...
EURUSD