- Search Crypto Craft
- 41 Results
-
 frx_trader replied Apr 9, 2017
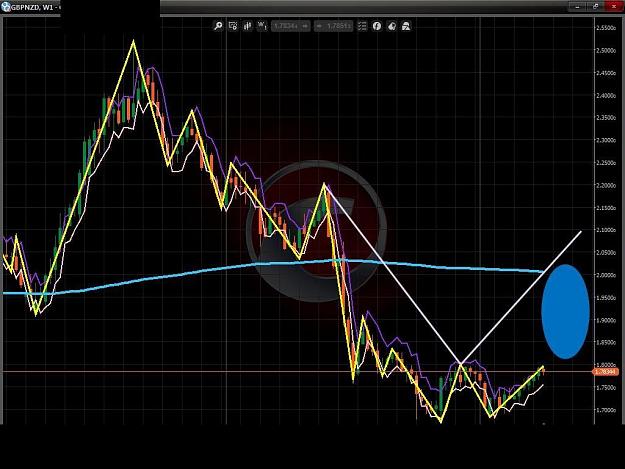
GBPNZD Weekly. Blue Space waiting to be Filled.
GBP/JPY, GBP/AUD, GBP/USD live entry review
- frx_trader replied Apr 9, 2017
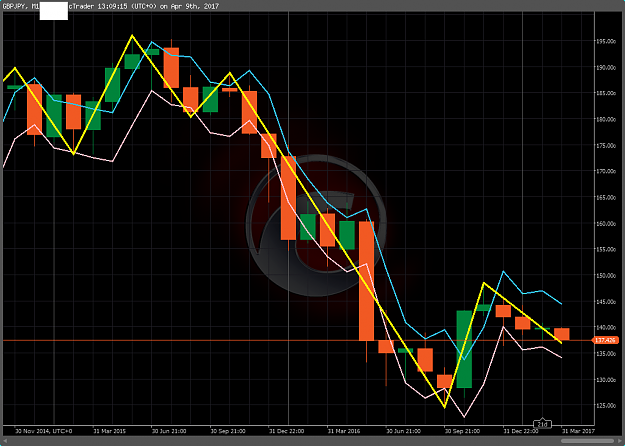
Monthly chart. GJ. My own created channel indicator.
GBP/JPY, GBP/AUD, GBP/USD live entry review
- frx_trader replied Apr 1, 2017
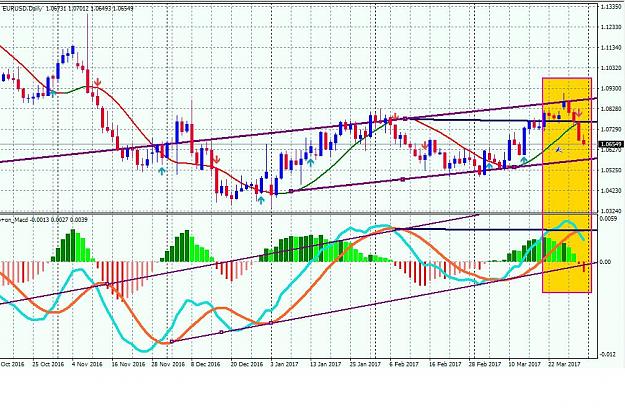
Daily chart. Note: Divergence of MACD ( Rising, New Peak) and Price ( Drop, New Low) around November 11 to End of January.
EURUSD
- frx_trader replied Mar 27, 2017
Arg....h. I love the companion of my cbot robot. It doesn't give a feck what you think and who you are. And it will behave as long as you are good with it. Well, It gives lots of profit $200 more to my demo account. But it feck up my live account. ...
EURUSD

- frx_trader replied Mar 25, 2017
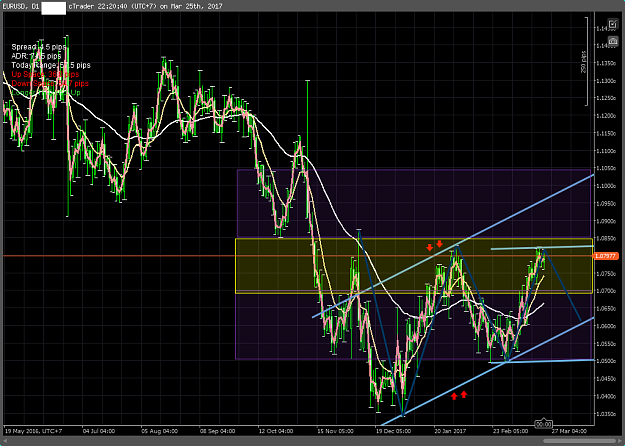
Daily chart. The purple areas are possible future. Downside low 1.0620 (sounds familiar). Upside high 1.0960 -1.1050 (New highs).
EURUSD
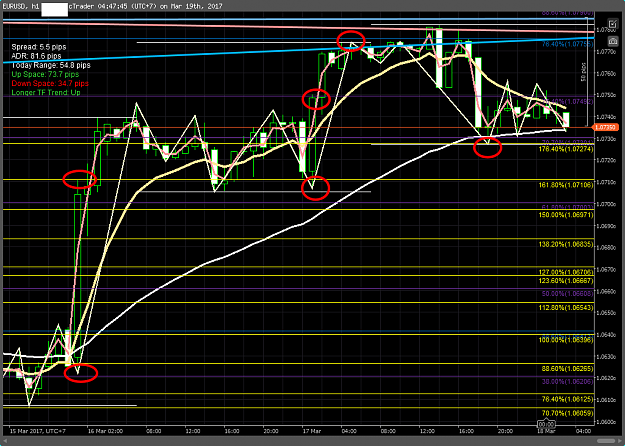
- frx_trader replied Mar 18, 2017
Here is 1 HR chart. Daily, Weekly, Monthly Fib. 1.0825 ( 261% DF) 1.0871 ( 112% WF) 1.071 ( 162% DF) 1.0654 (112% DF) 1.0640 (100% DF)
EURUSD
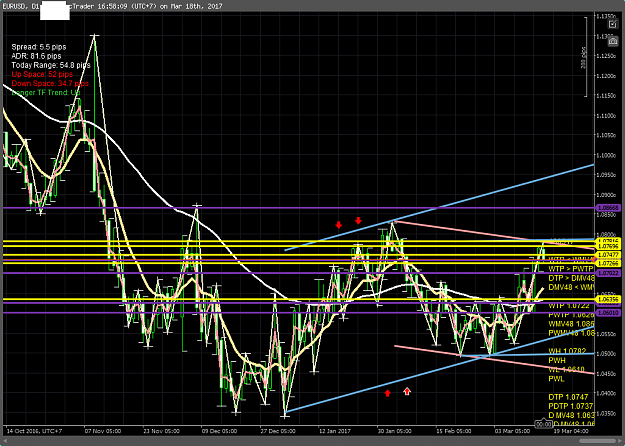
- frx_trader replied Mar 18, 2017
My daily chart. Pay attention to the blue channel and the price level.
EURUSD
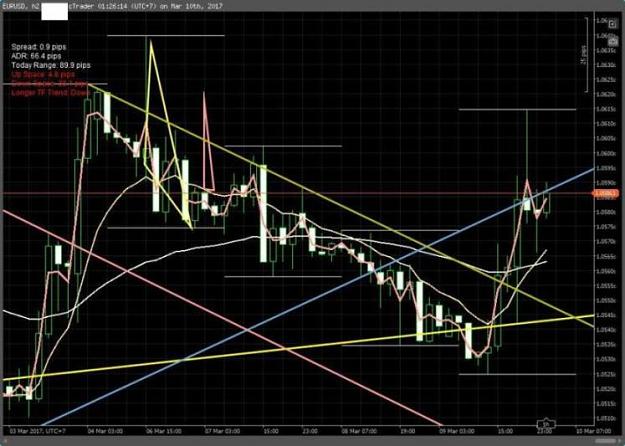
- frx_trader replied Mar 9, 2017
EU 2hrs. Yellow lines form triangle. Cuurent trend : Blue line. Note : Pink tracking curve and zigzag.
EURUSD
- frx_trader replied Mar 6, 2017
I redraw it. Here it is. That's the setup I use. I don't know if it's a classic WW or not. But it works ok for me. Yeah, not all pips, but 40 pips TP. I will extend my TP when I develop confident in WW. Thanks.
Wolfe Waves - Get in the Zone
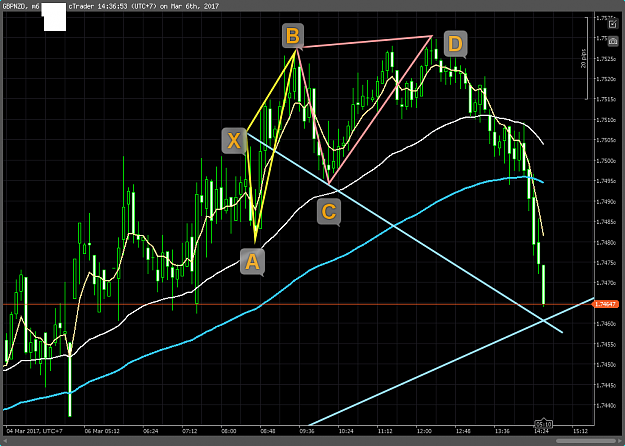
- frx_trader replied Mar 6, 2017
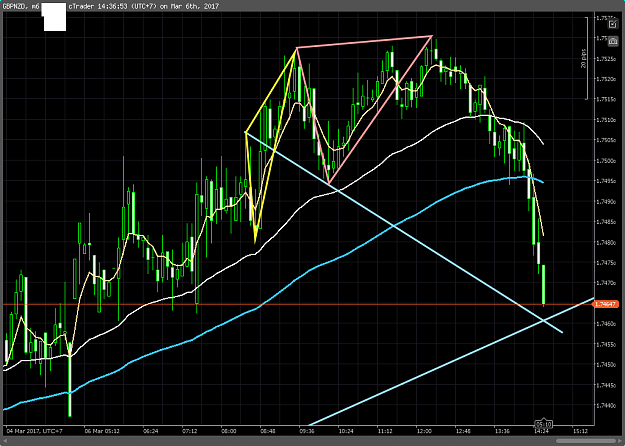
GBPNZD, 6 min Today. Wow, WW is unbelievable.
Wolfe Waves - Get in the Zone
- frx_trader replied Mar 4, 2017
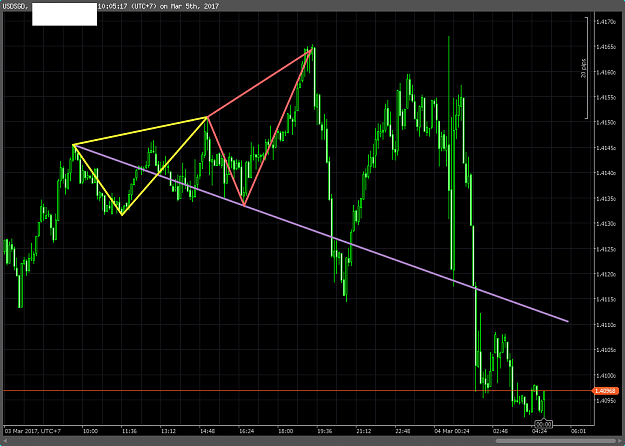
Finally. My 1st WW. USGDm 6 min. This is fun.
Wolfe Waves - Get in the Zone
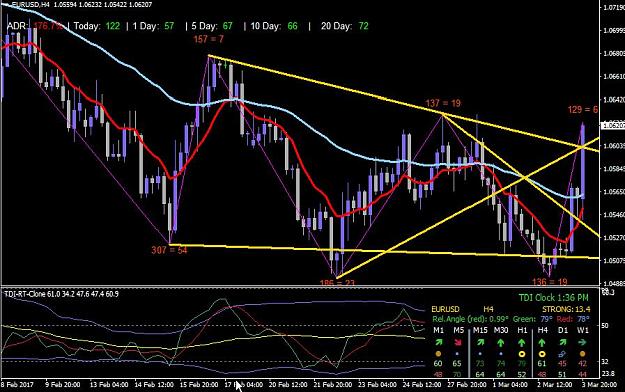
- frx_trader replied Mar 4, 2017
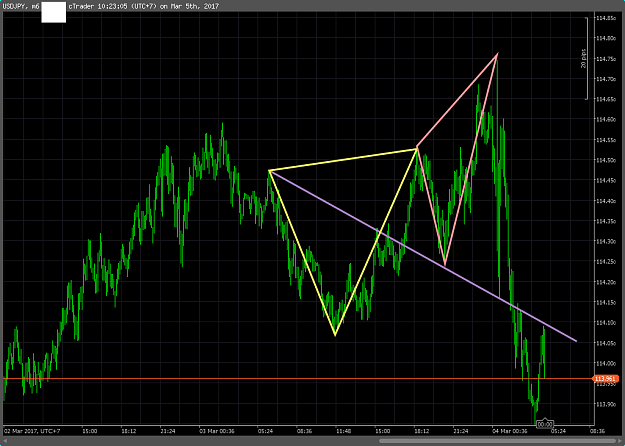
Same questions to anybody. This is EU 4HR chart. 1. Is this Bullish or Bearish Wave? 2. Do I long or short? 3. Where is my point of entry? 4. Where is my TP and SL.? Thank you.
Wolfe Waves - Get in the Zone
- frx_trader replied Mar 4, 2017
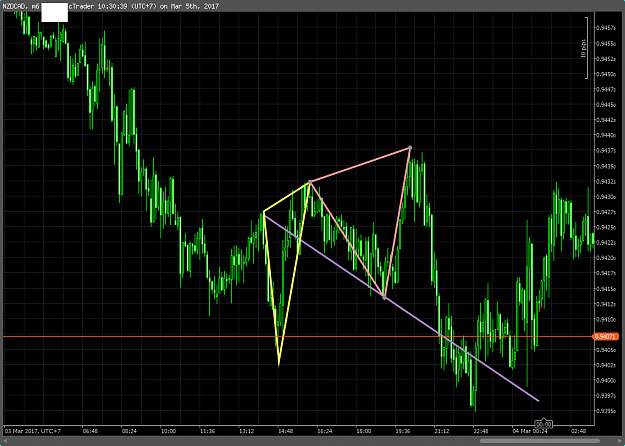
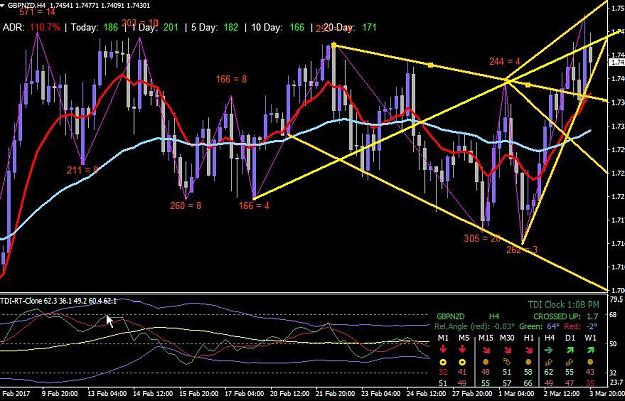
Expo or anybody. Help me pls. Since I am new and haven't read yet the full description of WW. Here is 4 hrs GBPNZD chart. 1. Is this Bullish or Bearish Wave? 2. Do I long or short? 3. Where is my point of entry? 4. Where is my TP and SL.? Thank you.
Wolfe Waves - Get in the Zone
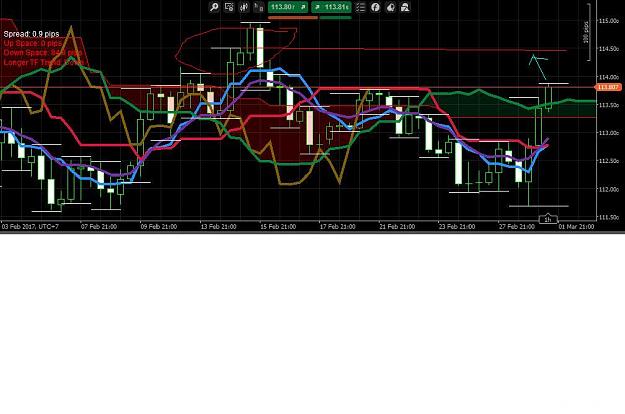
- frx_trader replied Mar 1, 2017
Next Stop for Bullish move 114.50. It's beginning of the month. So be careful to hit the top of 117
USD/JPY Discussion
- frx_trader replied Feb 14, 2017
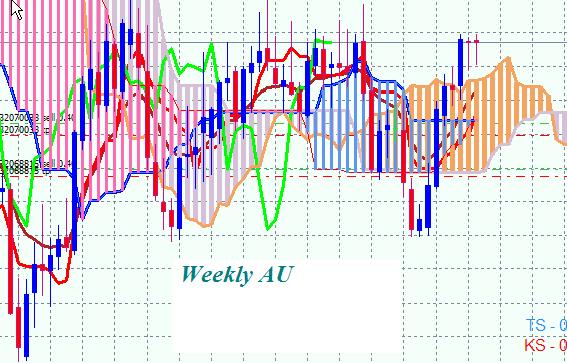
Today is Wednesday. Time is running out on AU. If it doesn't break .77 this week. We can see .75 next week.
AUD/USD
- frx_trader replied Oct 3, 2016
Neutral. UJ 8 hrs chart. 3 hrs to the next candle. 5 bullish candle + 1 bearish candle in the last 48 hrs of trading time.
USD/JPY Discussion
