- Search Crypto Craft
- 24 Results
- flyer415 replied Mar 10, 2015
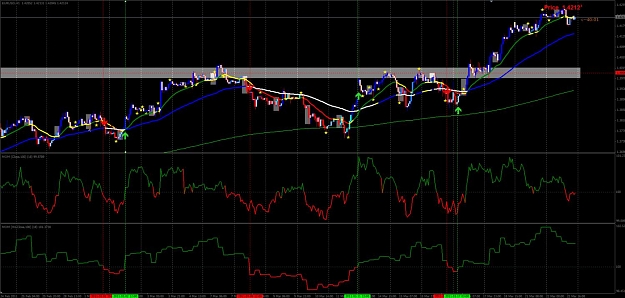
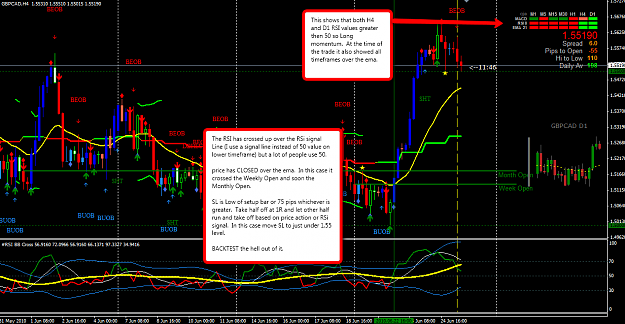
JanFx, Here is a modification to your original breakout concept. I am a H4/D1 trader so I am using H4 in this example. The Cloud (9,25,34 your inputs) and the 10 SMMA PAC appears to be as good as a Trend Identifier as most other systems so use it. ...
Another System for Breakout (ASB)
- flyer415 replied Feb 3, 2013
Here is probably the best function that I have seen to use for this. It uses Fib levels so it is to the right, it can ne labelled and it can include price. The variable "move" is an int declared in user input and it allows you to move the ...
Auto Pivot Indicator change?
- flyer415 replied Sep 23, 2011
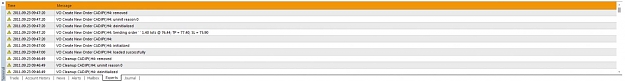
EDIT: YOU CAN IGNORE THIS POST AS I COPIED ENTIRE DIRECTORY FROM PREVIOUS INSTALL FROM SAME BR0KER AND HAVE IT WORKING NOW. NOT SURE WHAT HAPPENED BUT I WILL LEAVE POST HERE FOR COMPLETENESS SAKE. Not sure what I did here but I will relay what ...
VO-Pro: Comprehensive visual order management system for MT4
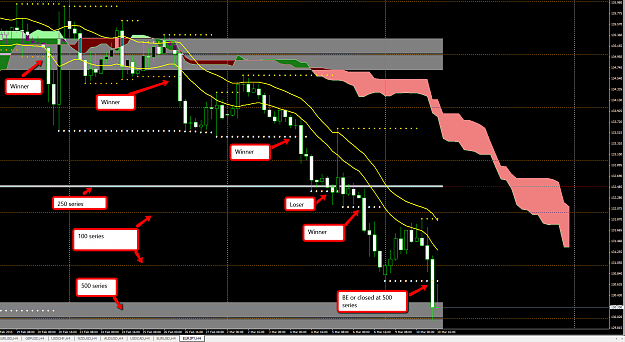
- flyer415 replied Sep 13, 2011
here is a modded grid overlay that I use to see the 500 series easily. I originally had it for 4 digit and I never changed it for 5 digit broker so use 5000 as Hgrid Pips and 200 for PipWidth. This will create a 20 pip buffer (+-20 pips) around the ...
PTT Method (Profitable Trend Trading) in Forex
- flyer415 replied Jul 14, 2011
the longer TFs work with my life. I have 4 children ranging in age from 8 to 20. There is no rush. Are the setups on longer TFs better? Better can mean anything and different things to different people. I find them to be very solid. You have time to ...
SECRET Trading System
- flyer415 replied Jul 14, 2011
This is why it is good to have multiple entry techniques.
SECRET Trading System
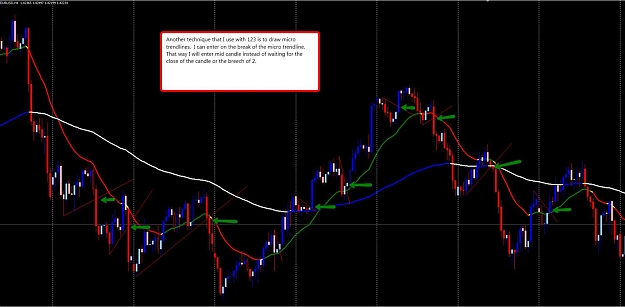
- flyer415 replied Jul 13, 2011
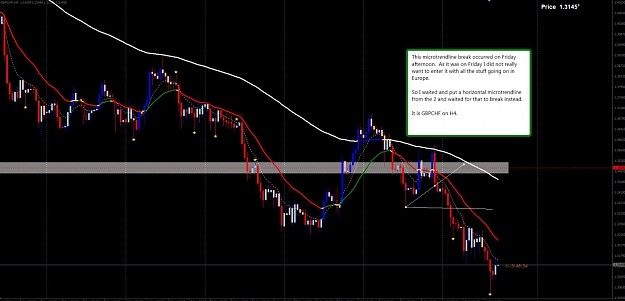
Here is another entry technique I use on 123. I draw microtrendlines from 2 to 3. When the micro trendline is broken then I can enter. Teb does something very similar.
SECRET Trading System
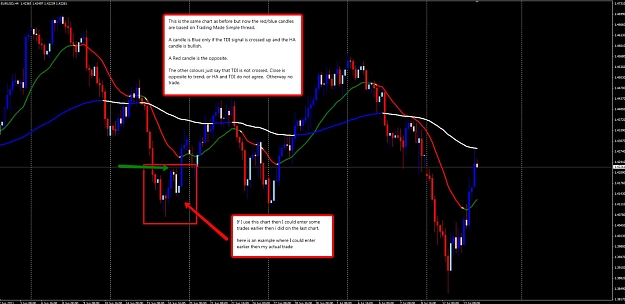
- flyer415 replied Jul 13, 2011
Here is another view of the same chart as before. In this case I coloured the candles based on Eelfranz's criteria of TDI cross and HA candles. You can enter on a Blue candle long or short a Red candle. The other candles tell you that HA, TDI are in ...
SECRET Trading System
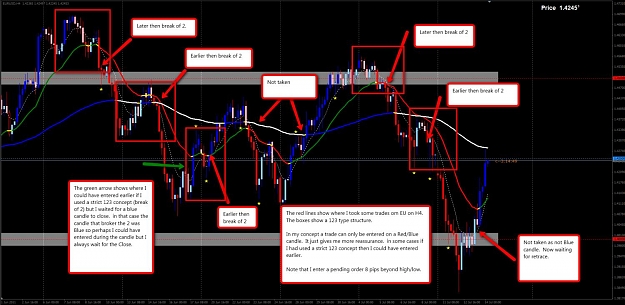
- flyer415 replied Jul 13, 2011
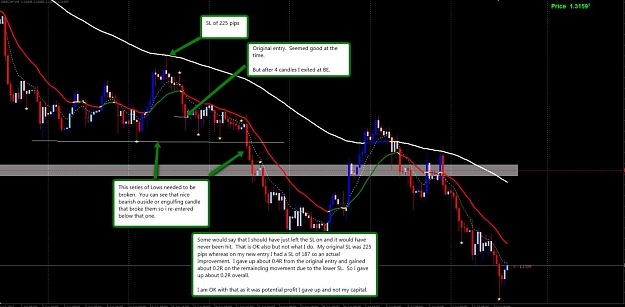
Here is a chart of how I use 123. The basic structure of 123 is followed but i am not hard and fast about entering on breech of 2. On a trending type trade I will enter as soon as candle is blue/red or it breaks the 21. The structure of HH-HL or ...
SECRET Trading System
- flyer415 replied Mar 24, 2011
Webglobe, I guess that I was thinking that the filter was "You only trade in the direction of the H4 Momentum". So in your example the trade should not have been taken as Long because the H4 Mom showed Red. My thought (for what they are worth). Use ...
MA + Momentum system
- flyer415 replied Mar 22, 2011
Mastscalpa, Instead of a using another indicator as a filter have a look at using a higher timeframe on your Mom indicator. I just recoded an MTF RSI indicator to a MTF MOM indicator using mladen's original code. I have attached the indicator as ...
MA + Momentum system
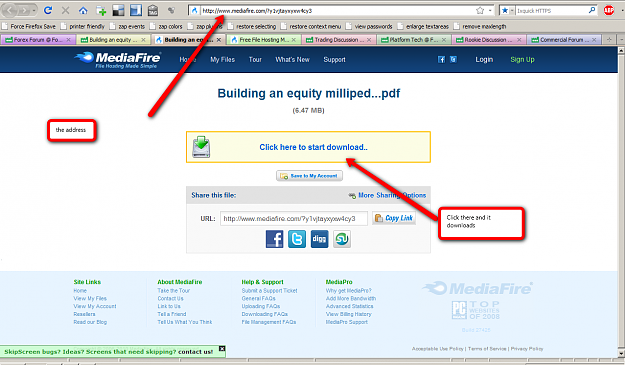
- flyer415 replied Jul 26, 2010
Not sure what you are missing but here is what mediafire should look like when you click the link in the post. Don't think I can make it any easier then that.
Building an equity millipede
- flyer415 replied Jun 25, 2010
instead of using an indicator to show the RSI arrows I suggest that you use a candle colouring idea. Look for an indicator called "rsi candles". make them blue if rsi > 50 and red if rsi < 50. now you have both the rsi concept and price action ...
EMA/RSI Trend Spotter system
- flyer415 replied Jun 15, 2010
I took GJ Long. Sl at 20 pips with 20 pip instant trail and TP at 30. Currently about 3 pips locked in on trail. Demo and in hindsight the spread is too large on this.
ALF revisited - simple, effective daytrading
- flyer415 replied Mar 26, 2010
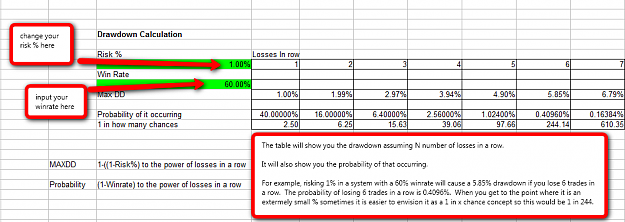
Here is a quick spreadsheet that i have used in the past. It takes your winrate and %risk in account. It will tell you the MAX drawdown as well as the probability of that occurring. It assumes that your winrate is known and that you adhere to your ...
How many losses can I sustain?
- flyer415 replied Dec 17, 2009
EDIT..See Post 2019. It appears that I inadvertently crossed timezone changes on 01 Apr 2008 as London went into summer time. Post 2019 shows corrected data for Jan to mar 2008. I backtested DubaiTrader's method of using the Slope Indicator as a ...
0400-0700 GMT Breakout Strategy
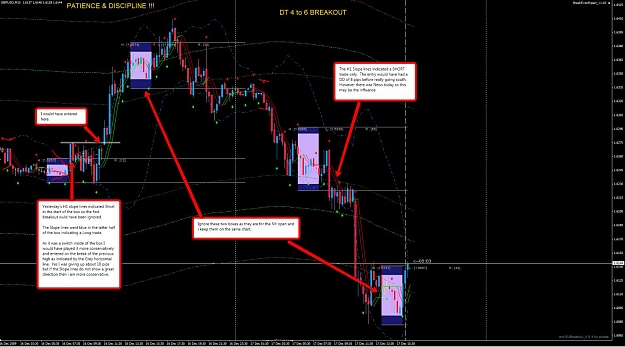
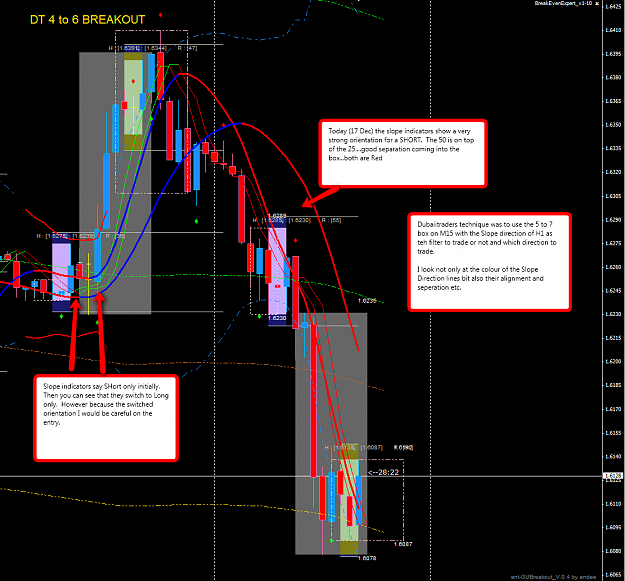
- flyer415 replied Dec 17, 2009
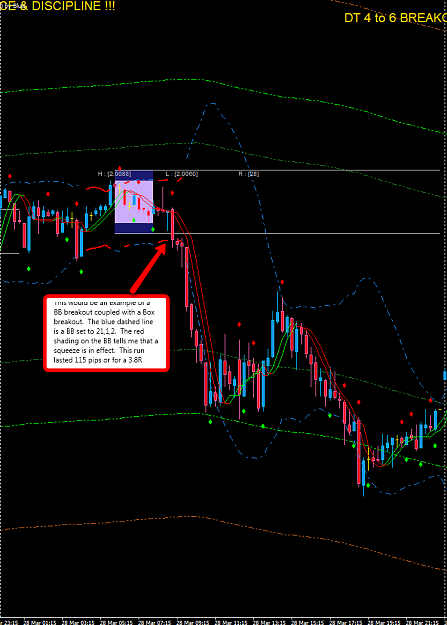
Maq, here are charts on DubaiTrader's approach. Note that the settings for the Slope Direction lines are 25,3,0 and 50,3,0. Note also that DT uses a 5 to 7 GMT box but the example that I am showing is the 4 to 6 box that Grant uses. Sorry but that ...
0400-0700 GMT Breakout Strategy
- flyer415 replied Dec 11, 2009
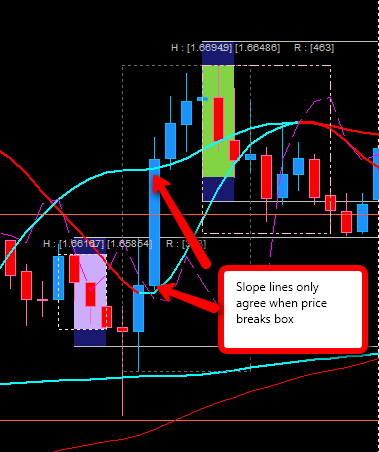
This question concerns using the SLope Direction line as DubaiTrader uses it. Do the two slope direction lines have to be in agreement with each other and direction when price breaks the box or upon completion of the box. The attached picture shows ...
0400-0700 GMT Breakout Strategy
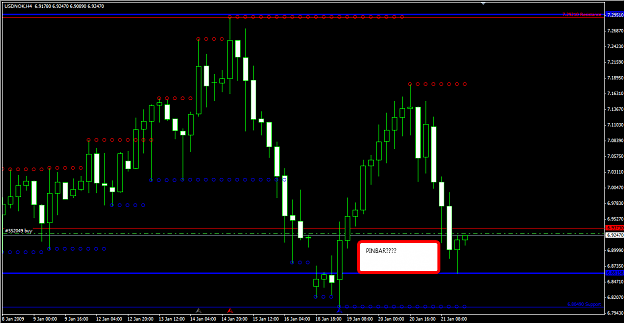
- flyer415 replied Jan 21, 2009
OK, so i blew 2 PBs last night because they were not PBs. Got saved by you guys on the thread telling me so. Here is another. PB or Not. I have place a pending trade.
james16 Chart Thread