- Search Crypto Craft
- 47 Results
-
 felixcattus replied Mar 30, 2016
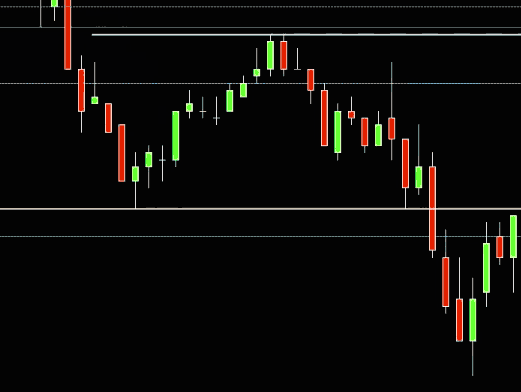
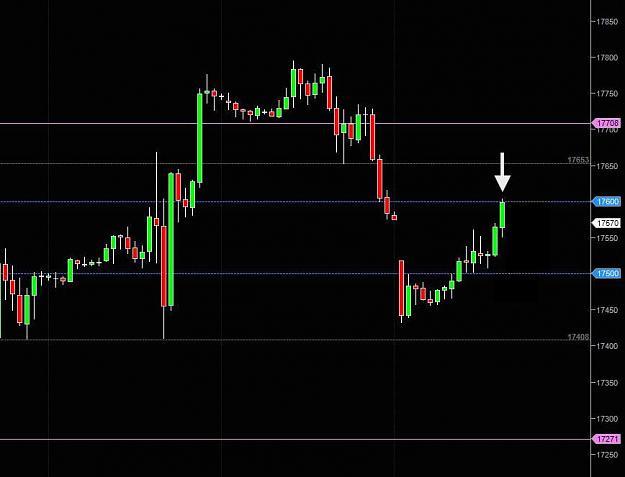
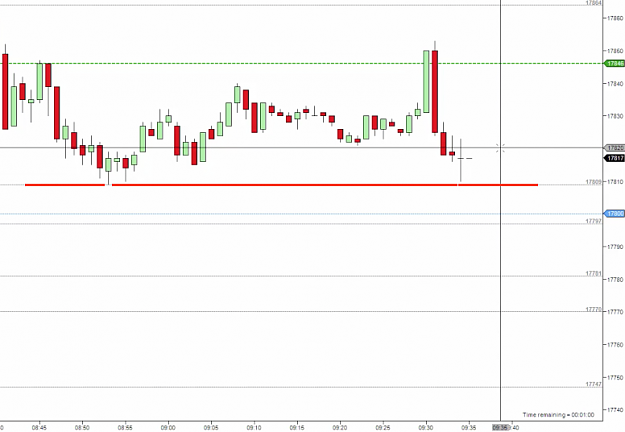
Today was really harsh for me but a lesson worth sharing in detail. I came into the morning marking off 2 levels below market that I knew I wanted to get long off of. The reason for this was the H1 chart. Coming into the open, we had an H1 pin bar, ...
Scalping the Mini Dow off the M1 Charts
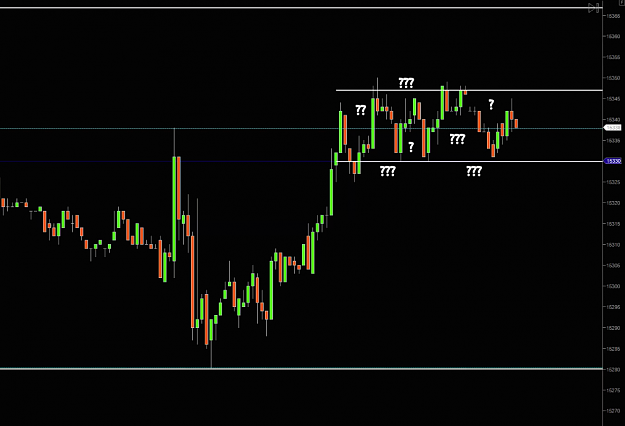
- felixcattus replied Mar 17, 2016
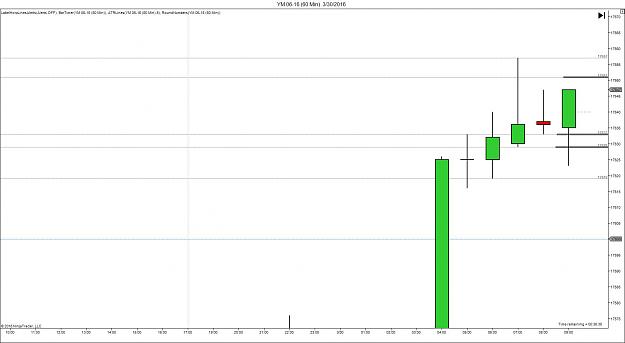
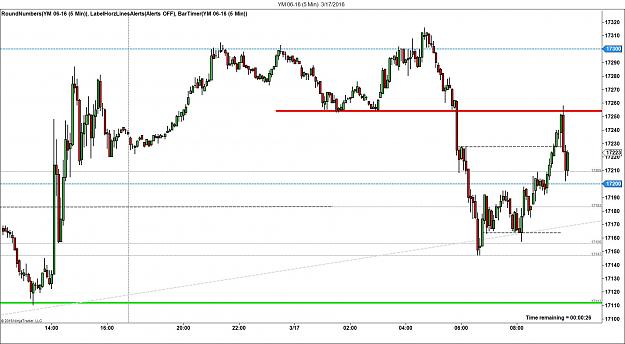
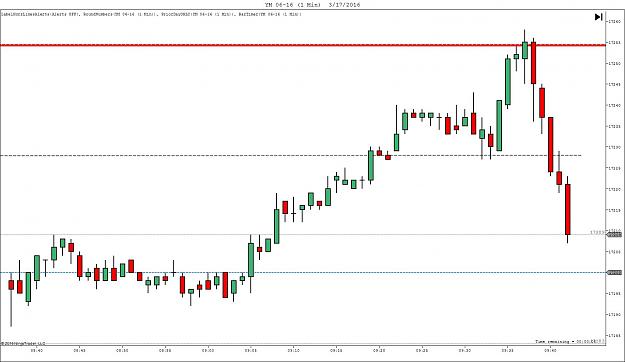
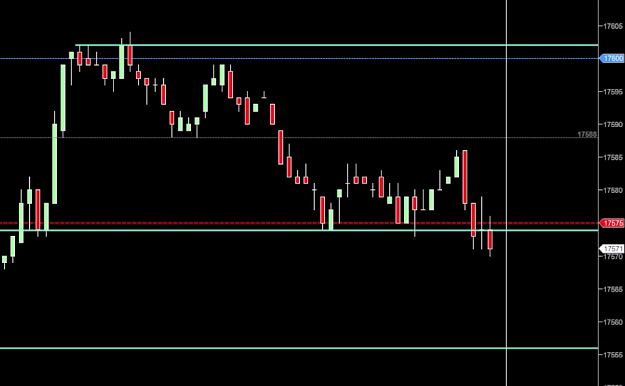
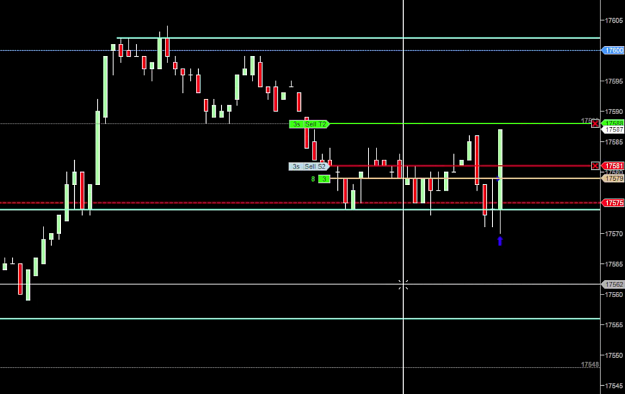
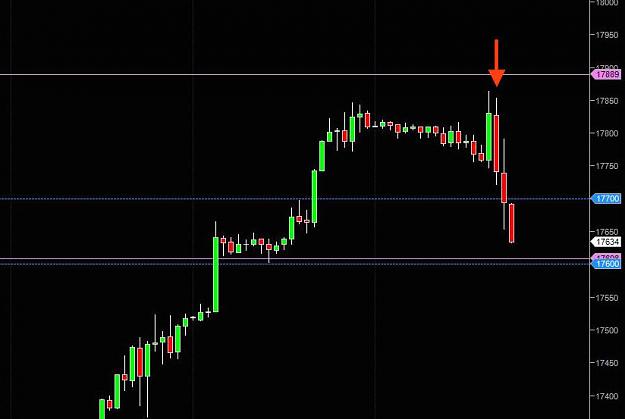
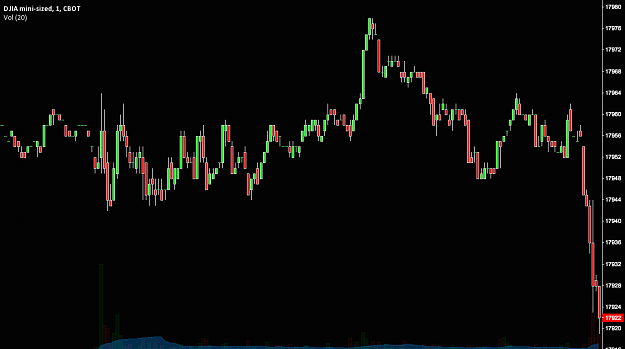
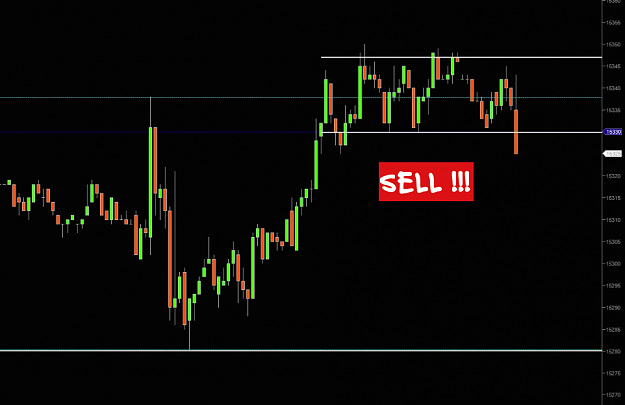
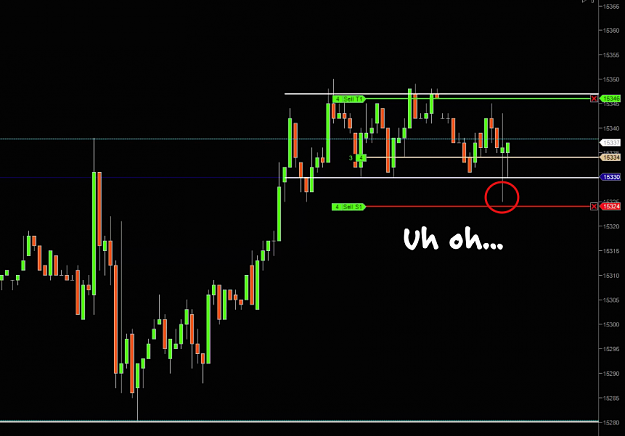
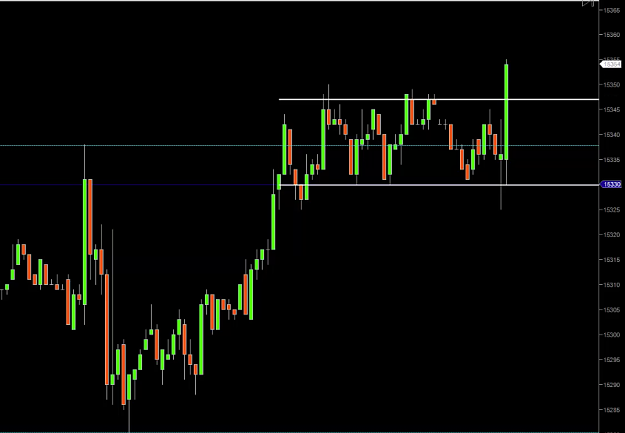
Happy St. Patrick's Day! This morning's trading video. video To give some context to the level I sold (unsuccessfully at first), here is what I was looking at on a higher timeframe: image image
Scalping the Mini Dow off the M1 Charts
- felixcattus replied Mar 10, 2016
Morning everyone! I didn't trade Tuesday or Wednesday. This morning though we saw the minimum bid rate for the Euro unexpectedly come out at 0.00% v.s. the expected 0.05% so the market this morning was pretty active. This morning's trading video: ...
Scalping the Mini Dow off the M1 Charts
- felixcattus replied Feb 2, 2015
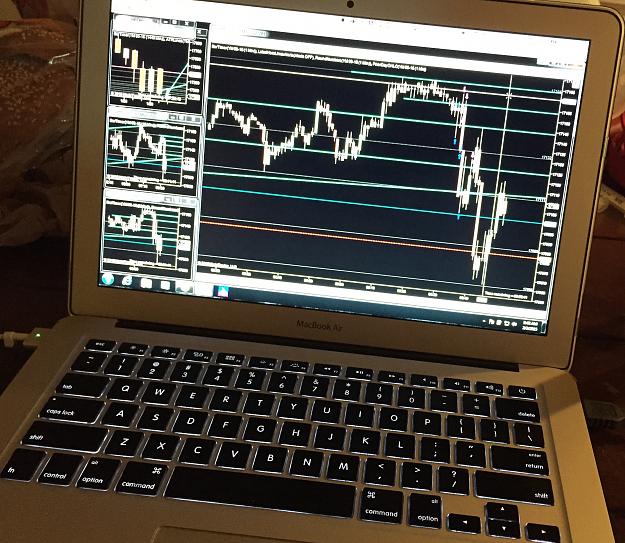
I'm currently traveling and traded from a laptop this morning from a friend's house. Here's a pic from after the dust settled. image I generally laugh when I hear stories about people trading from the beach, or from space or some other such ...
Scalping the Mini Dow off the M1 Charts
- felixcattus replied Feb 2, 2015
Happy Monday and February everyone. This morning's trading video, which was certainly a little rocky. video On my 3rd trade, the play was a reversal off the 100 round number after a nice momentum move. The trigger for this trade was the fact that ...
Scalping the Mini Dow off the M1 Charts
- felixcattus replied Jan 26, 2015
I was short biased coming into the open this morning. In general, it's perfectly fine to have a bias, so long as you take it in context and don't become too "committed" to your bias. Becoming over-committed to a bias leads to trading what you ...
Scalping the Mini Dow off the M1 Charts
- felixcattus replied Jan 16, 2015
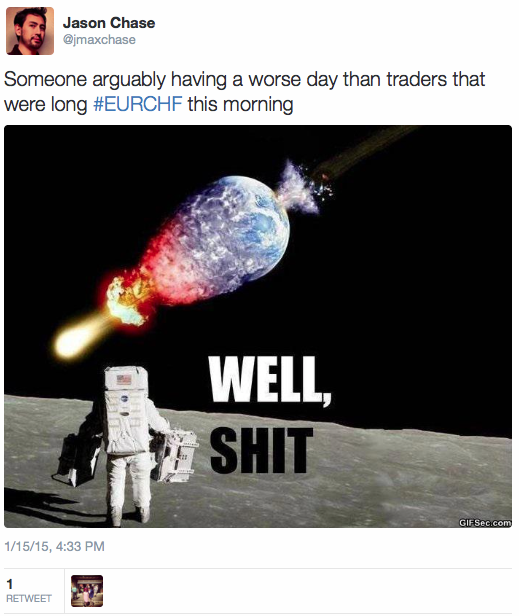
I posted this the other day on twitter. image I really hope everyone is safe this week and I know of a few people that made a killing on Thursday, a few that took a small loss, and a few that went completely bankrupt and even have a negative ...
Scalping the Mini Dow off the M1 Charts
- felixcattus replied Jan 12, 2015
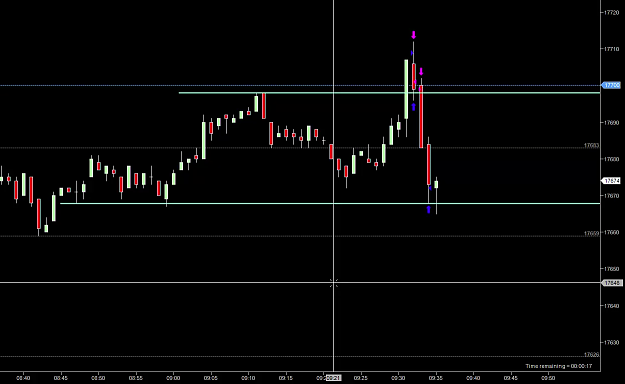
On that third trade, you'll notice there was that flash where, for a brief moment, it looked like price might reverse off of 668s. It even looked like a pin bar. image Given the context of the bull trap that formed above, and the quick rejection ...
Scalping the Mini Dow off the M1 Charts
- felixcattus replied Jan 12, 2015
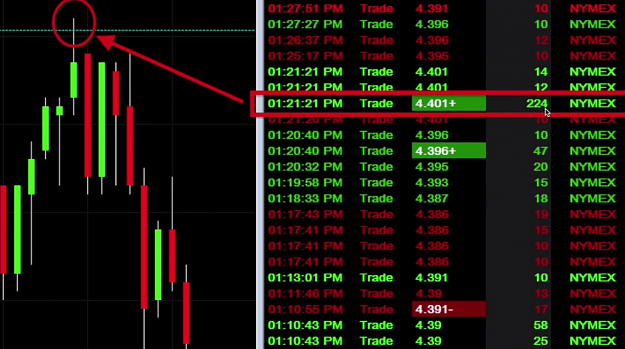
The amazing thing is, the pros do this to (buy at the worst place possible, sell at the worst place possible). Time and time again you can see this on a footprint chart / T&S. I happened to catch this beauty a while back but it's a great ...
Scalping the Mini Dow off the M1 Charts
- felixcattus replied Jan 9, 2015
When the market has clearly formed a bull trap (or bear trap) like that, I've found that more often than not, whatever the first obvious level of support (or resistance) stands in the way, it is likely to be taken out. In this case, it is the level ...
Scalping the Mini Dow off the M1 Charts
- felixcattus replied Jan 9, 2015
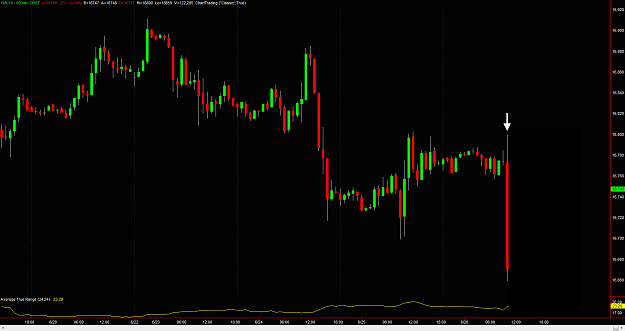
This is a hourly chart from June 6, 2014. The huge bearish engulfing candle is what ensued on the cash open - nearly a 150 point move to the downside. image What's interesting is how this move was set up. Looking at the 1 minute chart, 10 minutes ...
Scalping the Mini Dow off the M1 Charts
- felixcattus replied Jan 9, 2015
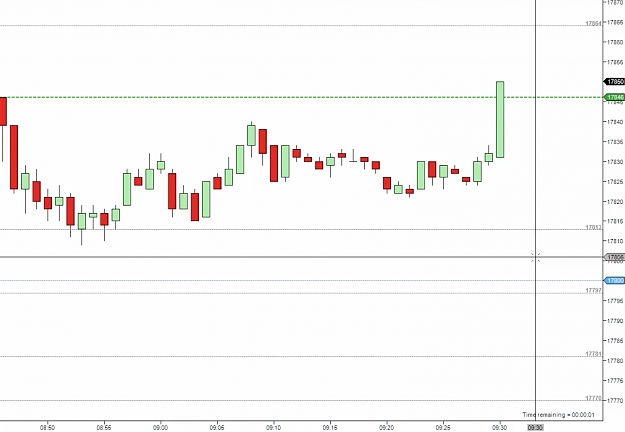
Today was NFP. Taking a look at the first 2 trades in more detail, coming into the morning open, just 1 minute before the cash open we had a run up in price, breaking through yesterday's highs and making a run up to 864s, the highs set by the run on ...
Scalping the Mini Dow off the M1 Charts
- felixcattus replied Jan 2, 2015
So then the market does provide a retrace. All the way down, it gets bought. First it is front-run, then bought at 964s, and then one last attempt at buying the 956s. When the market thrusts down sharply through 956s, anyone who has bought would be ...
Scalping the Mini Dow off the M1 Charts
- felixcattus replied Jan 2, 2015
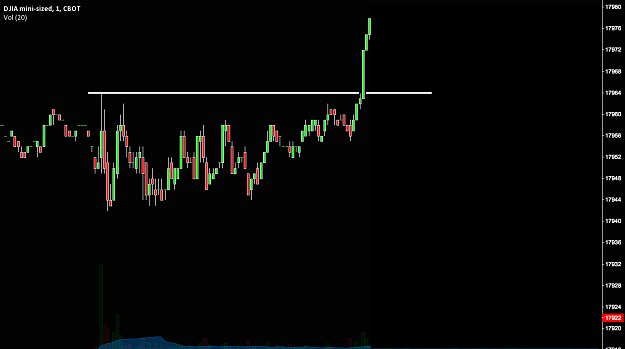
Remember, at some point, the market would have looked like this. image It's the explosion of price to the upside that is of particular interest. Demand exceeds supply and it shows on the chart. This is a breakout and the kind of move that everyone ...
Scalping the Mini Dow off the M1 Charts
- felixcattus replied Jan 2, 2015
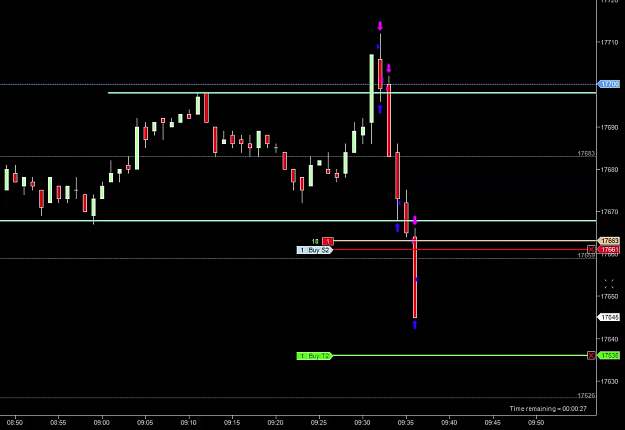
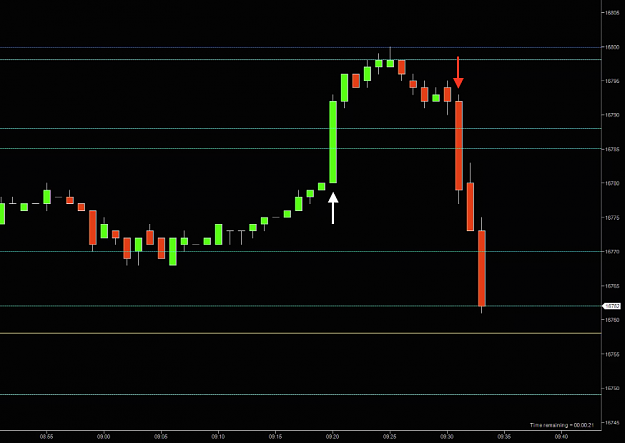
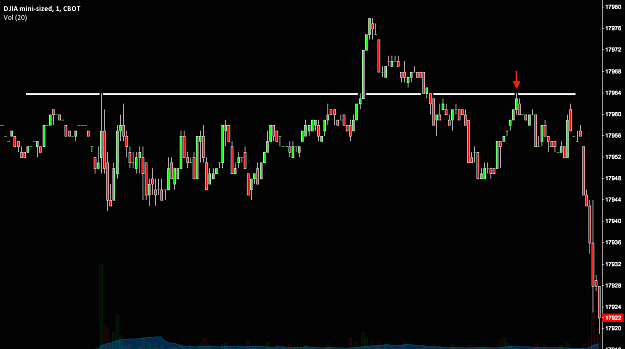
The setup would be a short on the retest of 964, highlighted by the red arrow. image You'll note that the S/R level itself doesn't stand out as being very well defined. In fact it's had only one touch immediately off the 9:30 open, and then the ...
Scalping the Mini Dow off the M1 Charts
- felixcattus replied Jan 2, 2015
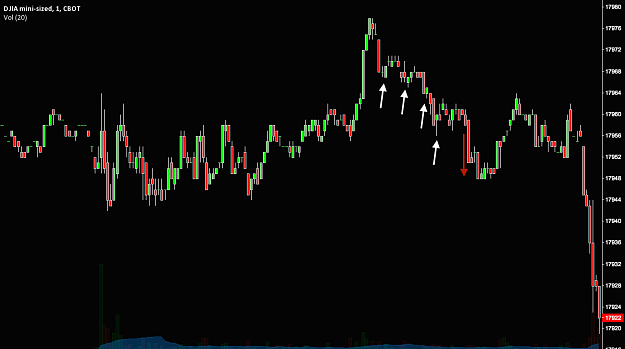
This was the YM 1 minute chart for Tuesday. image Now I realize I'm looking at this with the benefit of hindsight, but it illustrates one of my setups so I'll post it here. If you look at the chart, you may find it hard to see any spectacular S/R ...
Scalping the Mini Dow off the M1 Charts
- felixcattus replied Dec 29, 2014
Then the market breaks out to the downside. Sell stops are triggered (some for entering, some for exiting). Those on the sidelines now dive in. image ... and then the market does this: image Remember the pros want to buy in areas of the chart ...
Scalping the Mini Dow off the M1 Charts
- felixcattus replied Dec 29, 2014
So on with some more market basics. Let's examine this chart again from an orderflow perspective because it illustrates something key. When you look at this chart, you'll see highs, lows ... ranges. What does it all mean? Don't worry about that. And ...
Scalping the Mini Dow off the M1 Charts
- felixcattus replied Dec 29, 2014
I decided to trade this morning. Note that just because price makes a sharp run up doesn't always automatically mean it's a fade. But in this case it was, and a beautiful one. Where do most traders buy? After a run in price. And that's usually when ...
Scalping the Mini Dow off the M1 Charts
- felixcattus replied Dec 28, 2014
Another setup example. I do trade a classic break and retest of S/R levels. What price action traders will often do is look for confirmation that the level will hold by looking for a rejection candle (e.g. pin bar) off that key level and then act ...
Scalping the Mini Dow off the M1 Charts