- Search Crypto Craft
- 28 Results
-
 farukh replied Feb 9, 2023
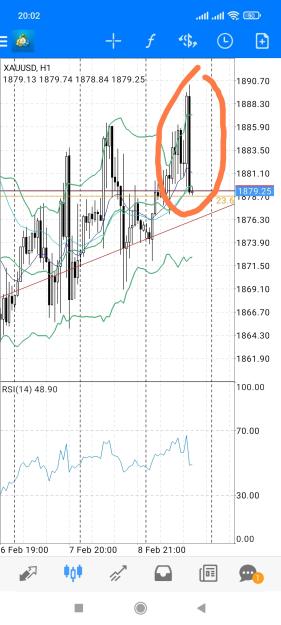
Uptrend intact but bearish engulfing found on H1. Be cautious about and wait for confirmation. Closed above 1890 is buy and tp 1920 Closed below 1860 will trigger downtrend image
XAU/USD & XAG/USD - Gold & Silver Traders Thread
- farukh replied Feb 9, 2023
Uptrend intact but bearish engulfing found on H1. Be cautious about and wait for confirmation. Closed above 1890 is buy and tp 1920 Closed below 1860 will trigger downtrend image
Gold

- farukh replied Feb 9, 2023
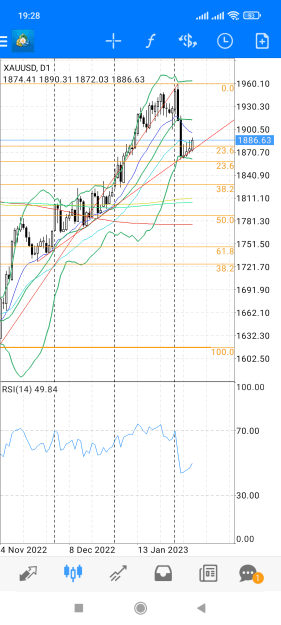
Daily time frame is still in uptrend unless closes below 1860 level image
Gold
- farukh replied Feb 9, 2023
Daily time frame is still in uptrend unless closes below 1860 level image
XAU/USD & XAG/USD - Gold & Silver Traders Thread

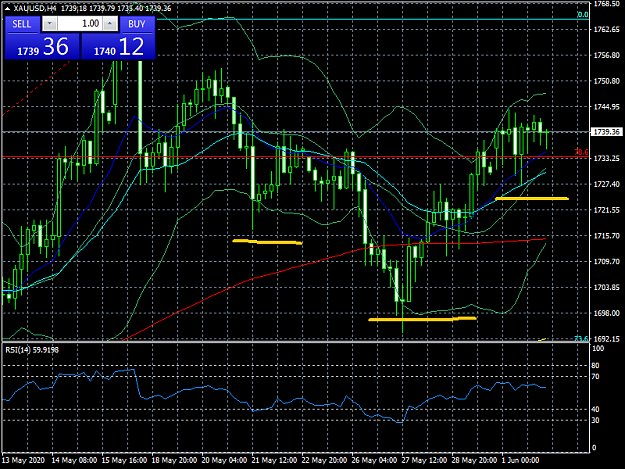
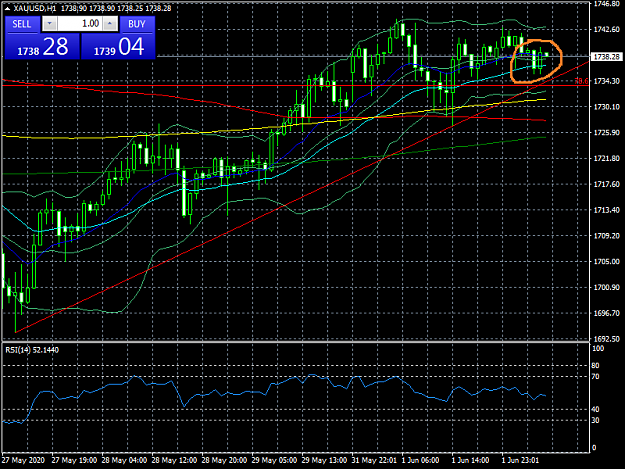
- farukh replied Jun 2, 2020
Inverse HnS formation on H4 chart image H1 is respecting trendline and bullish engulf has been formed image If trendline on H1 continues supporting and not broken then neckline on H4 expected to be broken for further longs.
4 + 1 (Metals) strategy
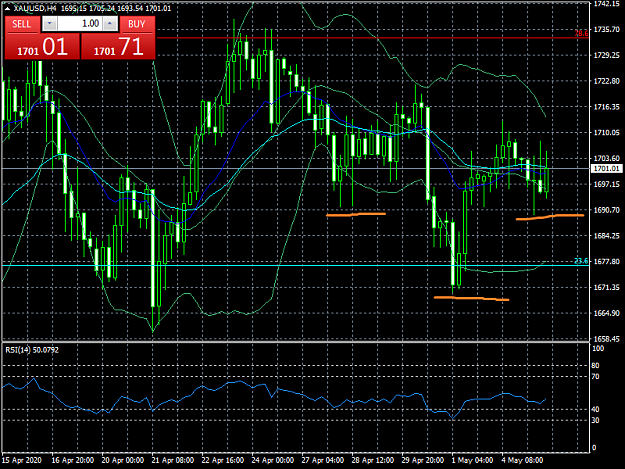
- farukh replied Apr 29, 2020
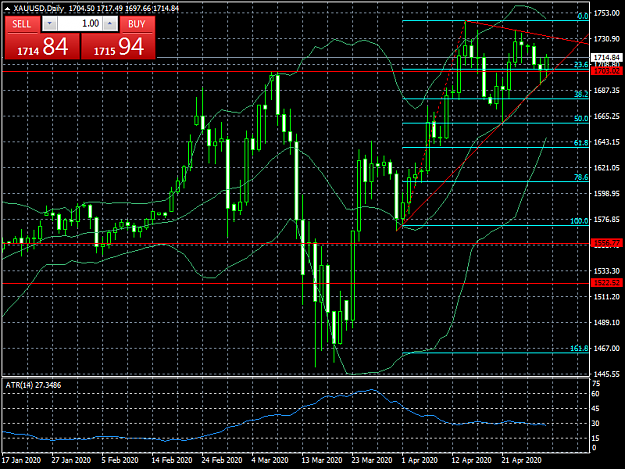
H4 is forming inverse HnS. I am keeping my long targeting neckline in short term @1733. If neckline is broken price may resume it journey towards the target of inverse HnS on daily chart. image image
4 + 1 (Metals) strategy
- farukh replied Feb 19, 2020
Testing call, please try on demo only. Candle colors pattern.. image
4 + 1 (Metals) strategy
- farukh replied Feb 19, 2020
I don't practice it but wants to learn. I was going through old posts from Nitsan Levi if you ever have come across this posts, he was Master. I have learnt a lot from him. I just saw again his successful calls with AB=CD and I saw similar pattern ...
4 + 1 (Metals) strategy
- farukh replied Feb 19, 2020
I also don't practice it but wants to learn. I was going through old posts from Nitsan Levi if you ever have come across this posts, he was Master. I have learnt a lot from him. I just saw again his successful calls with AB=CD and I saw similar ...
XAU/USD & XAG/USD - Gold & Silver Traders Thread

- farukh replied Feb 14, 2020
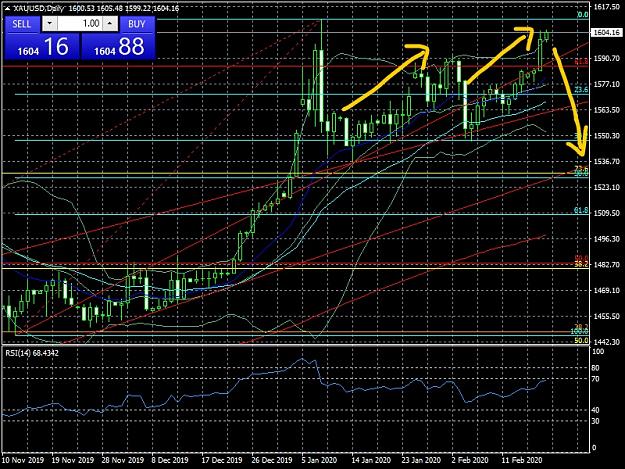
Divergence on daily chart, now where is the trigger price , I am not very good in intraday levels and intraday reversals. Furthermore, trendline on daily chart from 1445 is broken mentioned by circle and is not being retested. lets see if it holds ...
XAU/USD & XAG/USD - Gold & Silver Traders Thread
- farukh replied Feb 13, 2020
I just observed a very big divergence on daily chart, now where is the trigger price I think Obi can tell better, I am not very good in intraday levels and intraday reversals. Furthermore, trendline on daily chart from 1445 is broken mentioned by ...
4 + 1 (Metals) strategy

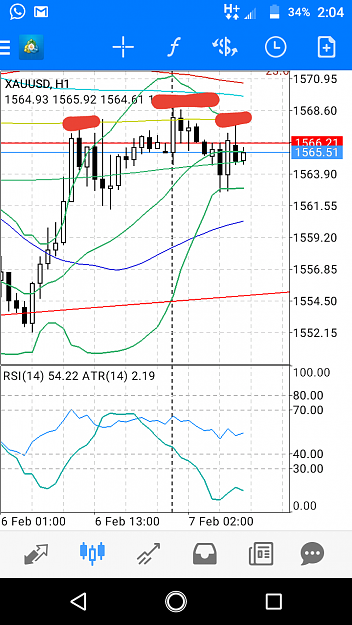
- farukh replied Jan 6, 2020
yes it is very strong support as it bounced back from long trend line shown in chart. However close above 1570 (resistance now) is must to go further long. close below this supportive trend line may bring big correction as Iran US matter is also ...
4 + 1 (Metals) strategy
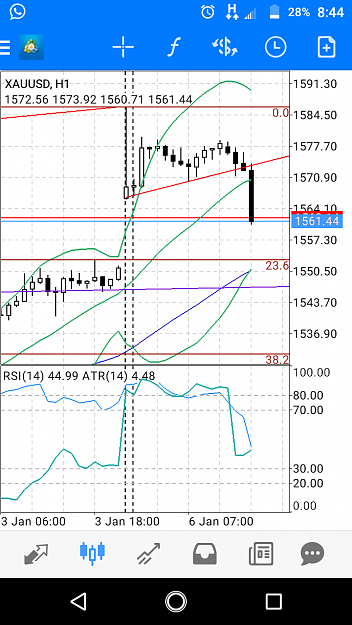
- farukh replied Jan 6, 2020
First downside breakout after making double top, must be filling the gap to start bulls again
4 + 1 (Metals) strategy
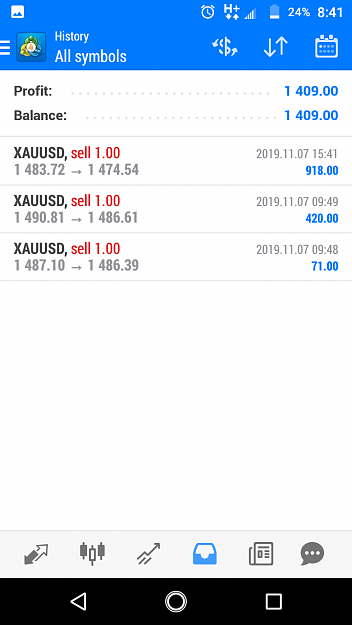
- farukh replied Nov 7, 2019
Managed to get some profit.. closed early but I think rightly because no body knew it would come back from 1474 or continue. image
XAU/USD & XAG/USD - Gold & Silver Traders Thread

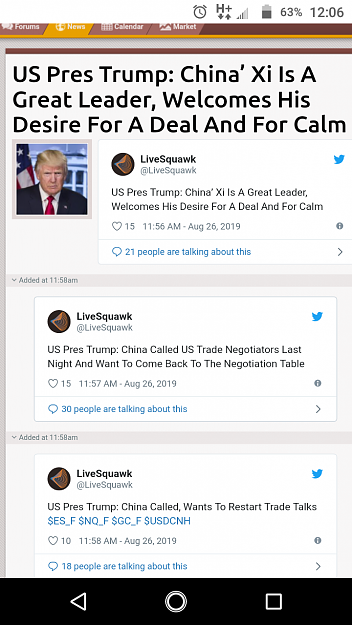
- farukh replied Aug 26, 2019
This man is playing game with us
XAU/USD & XAG/USD - Gold & Silver Traders Thread image
image
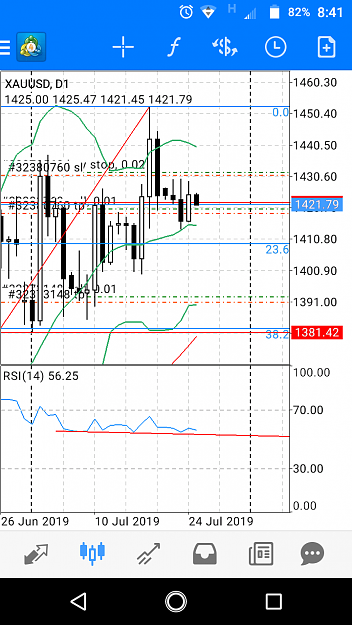
- farukh replied Jul 24, 2019
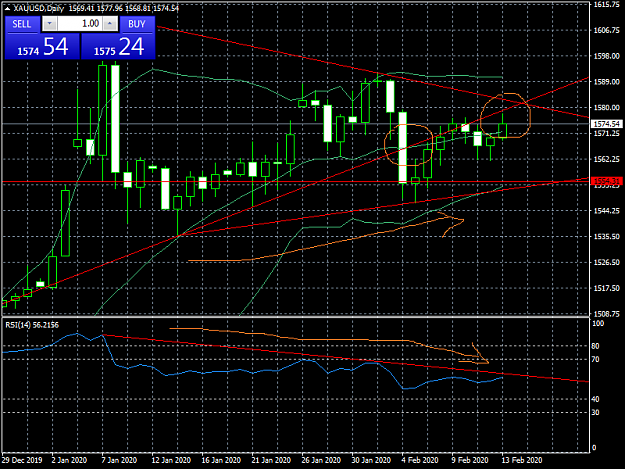
Support line is also formed in RSI. Sentiments are towards sell due to highly overbought but there are still ample indications of bull. A bit hard to take decision of one direction so far. image
XAU/USD & XAG/USD - Gold & Silver Traders Thread