- Search Crypto Craft
- 33 Results (2 Threads , 31 Replies )
- deanz replied Aug 12, 2011
needs plenty of fine tuning (like actually paying more attention to price/time) but 115 pips out of a 190 pip swing is a start. (exited part position then the rest).
Smexy Trades
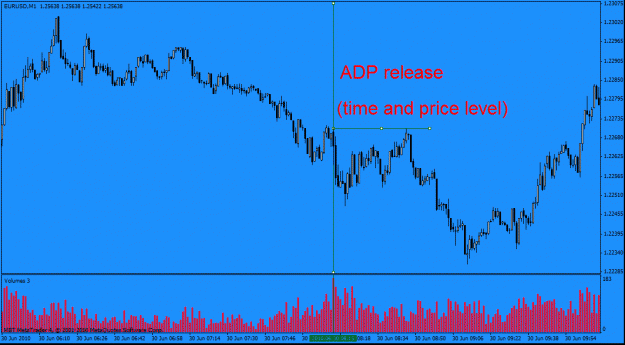
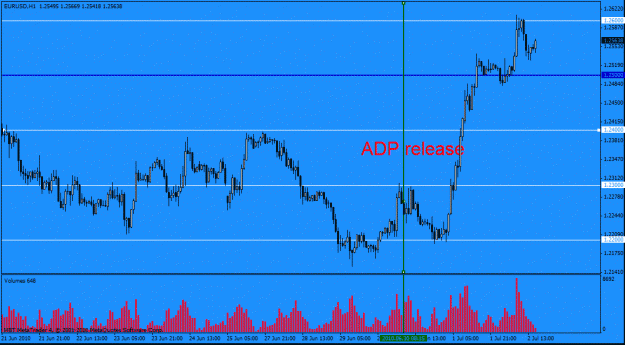
- deanz replied Jun 12, 2011
after NFP — NFP differed by about twice what a news trader would call a tradeable difference, so market was long the euro, therefore markets makers were either out of their longs, or were now short, I gambled on them being short, who really ...
Smexy Trades
- deanz replied Jan 20, 2011
hindsight trading — Darkstar said "produce ideas about exploitable situations" ... "set about looking for situations where the phenomena you noticed within the model occur" well I'm not that smart, so I do it the other way around, I see what I ...
Order Flow - Finding cluster of stops on chart
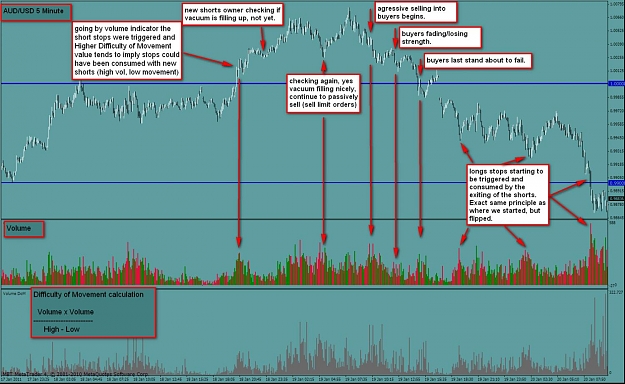
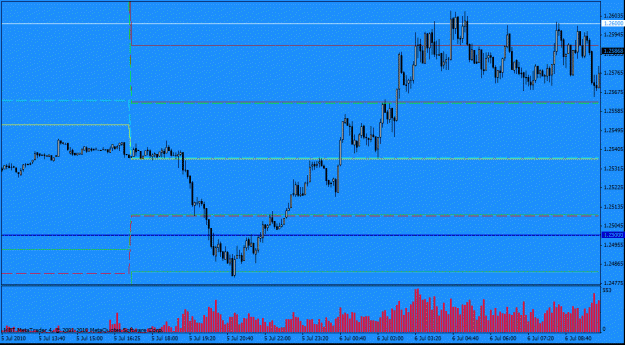
- deanz replied Jul 7, 2010
do you believe in pivot points.... Well it looks like someone does. This is daily pivots and yesterdays high low and close all based on 5pm New York Close. What I noticed was, and it isn't hugely obvious, is that price spent very little time at ...
Psychology and MM free zone...
- deanz replied Jul 3, 2010
Well I for one buy into this idea, the market maker knows the sentiment of the market because he/she/they are taking the other side of it. I have a strong suspicion the Market Maker is also an opportunist hunter, if most want to sell they buy, then ...
Psychology and MM free zone...
- deanz replied Mar 3, 2009
Max Volume Level indicator — For people who can not afford Volfix of Se7en I just posted a pretty basic Max Volume Level indicator over at: url Dean.
Volume Trading
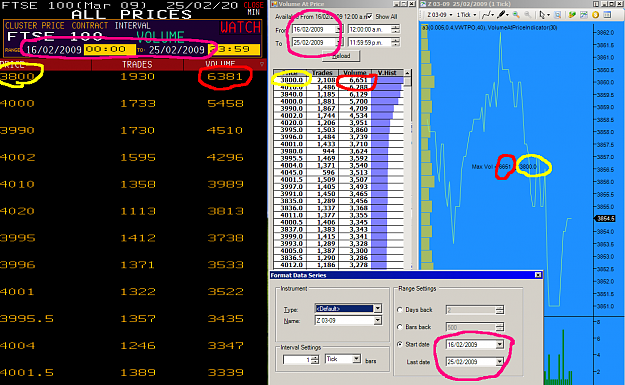
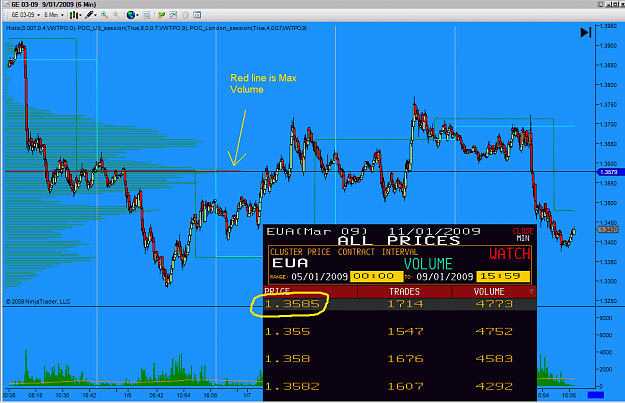
- deanz replied Feb 12, 2009
Volfix vers Ninja — Here is a week of data comparison, pretty darn close, what I like the most is though the visual of where the next big level of volume is. So the PEAK of the histogram is where the Max Volume occurred, but another thing ...
Principles of market movements
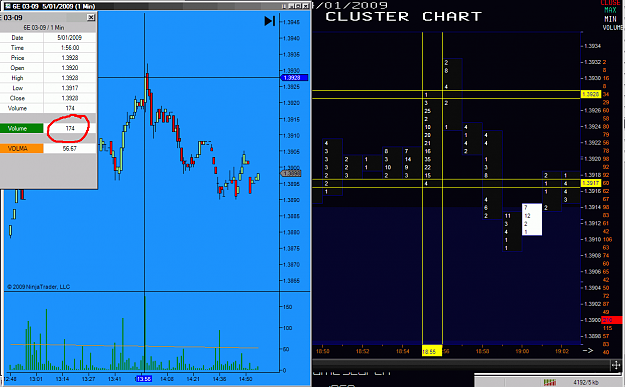
- deanz replied Feb 12, 2009
Volfix and Zen-Fire are the same Data. — I want to show that VolFix and the Zen-Fire data feed are the same cause I think this is important if you want to compare them. Check out the High Low and Volume on the Bar I have the cursor on in the ...
Principles of market movements
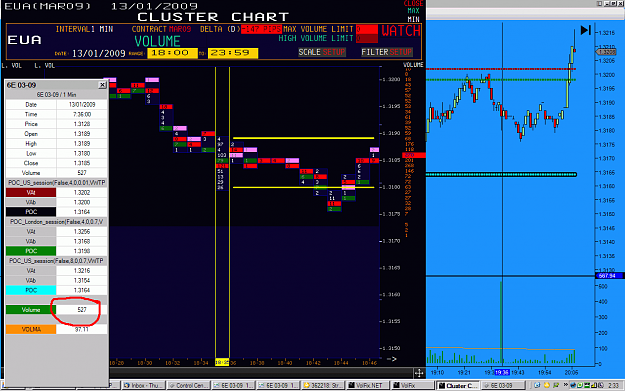
- deanz replied Feb 10, 2009
alternatives — We all knew Volfix would start charging for their product sometime, it makes no sense to invest so much development time into it otherwise. Anyway there are alternatives that will give similar information but display ...
Principles of market movements
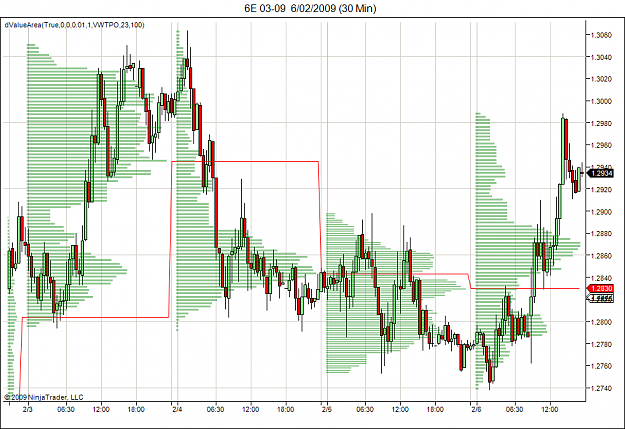
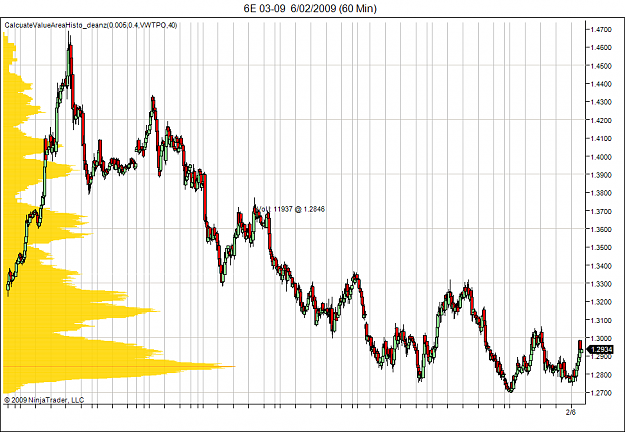
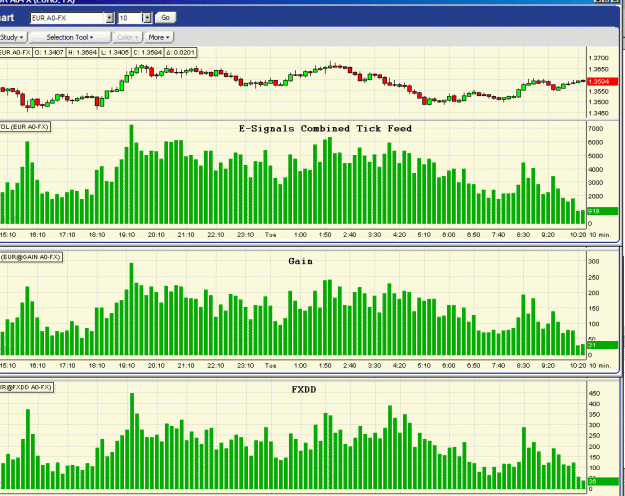
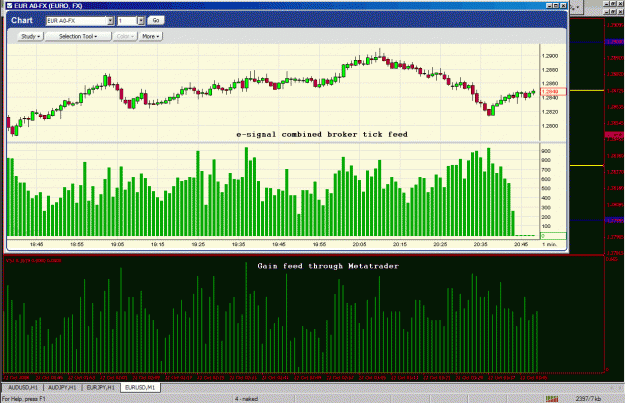
- deanz replied Feb 2, 2009
This first picture is of product e-signal sells, I demo-ed along with their normal program, and compared their combined broker feed [A0-FX] to their other, single broker feeds. There was some differences between some, but not much with the big ...
Application of Volume in Forex
- deanz replied Dec 29, 2008
the SHIFT key — If you want to extend a trendline without changing it's angle, select it, then while holding the SHIFT key, drag one end of it, this also works for moving Fibs sidewards...... and a few other objects. Try it :-) Also if you ...
MT4 navigational tips and techniques
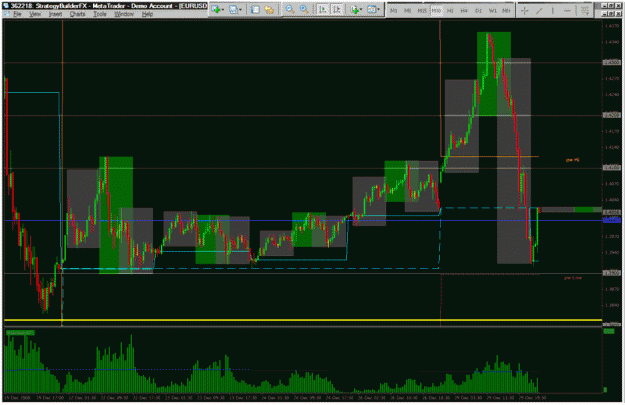
- deanz replied Dec 1, 2008
Nice example Roy. Here is another look that Cyrus may appreciate, where areas/levels overlap/confluence. Not that I trade my own indicators... but maybe I should, ha ha. Dean.
Gann Take Profit Levels
- deanz replied Nov 26, 2008
new indicators — Thanks Roy, yes that was an earlier version, as in the screen shot, that works just the same I just got tired of having to change the price level manually. I'm glad to hear you make use of it :-) that's great. Hey there Cyrus, ...
Gann Take Profit Levels
- deanz replied Sep 21, 2008
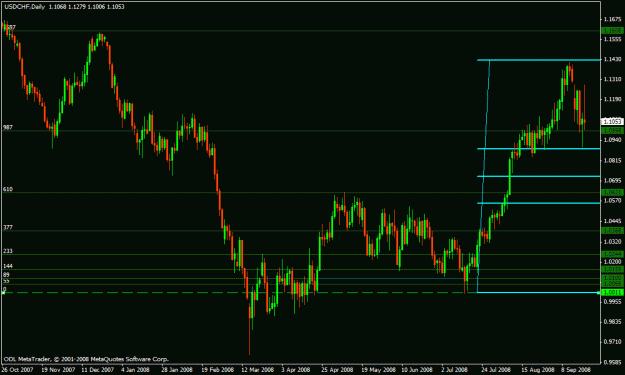
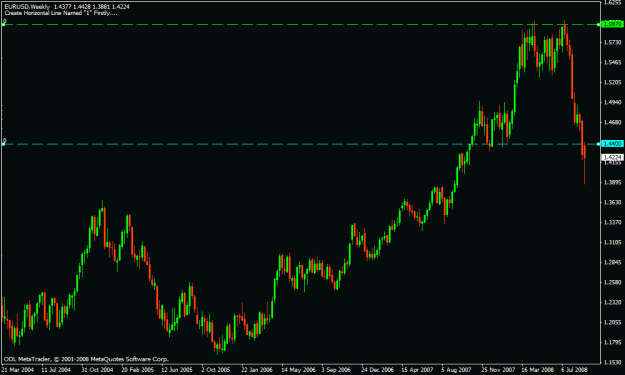
It's good Mouteki feels the USD/CHF is heading down because otherwise I may have come to this chart conclusion. The catch in my eyes being the USD has been defying fundamental logic..... we have been told the forex market is too big to be ...
New Mouteki Method...
- deanz replied Sep 16, 2008
Yes that looks like a short, and also this looks like a long..... the joys of trading..... for every technical reason to go long, there is another technical reason to go short. Looking forward to what Mouteki's fundamental section will teach us. ...
New Mouteki Method...
- deanz replied Sep 14, 2008
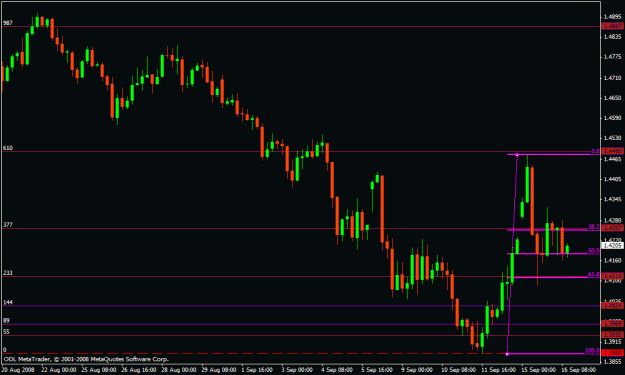
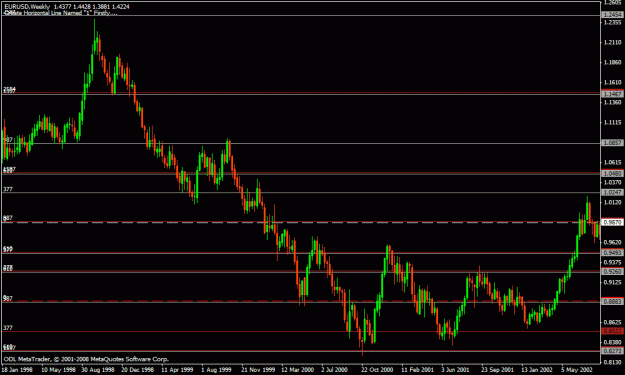
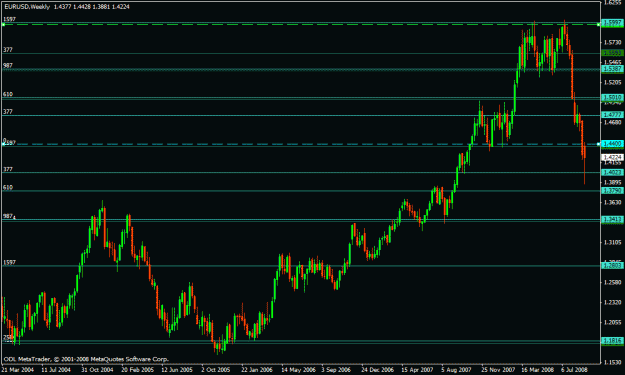
fib zones — I got some alternative ways in which to look at fib zones..... here is one of them. Using fib sequence numbers, move the decimal point on usable numbers, eg, 89 --> 0.8900 144 --> 1.4400 987 --> 0.9870 1597 --> 1.5970 then plot ...
New Mouteki Method...
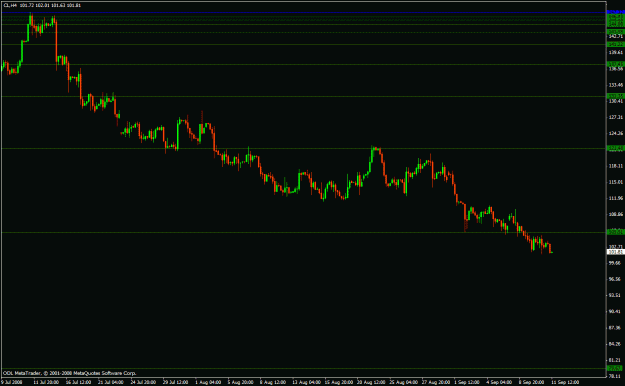
- deanz replied Sep 11, 2008
Oil — Oil.......... $79 a barrel ?? lets hope so........... Dean.
New Mouteki Method...
- deanz replied Sep 11, 2008
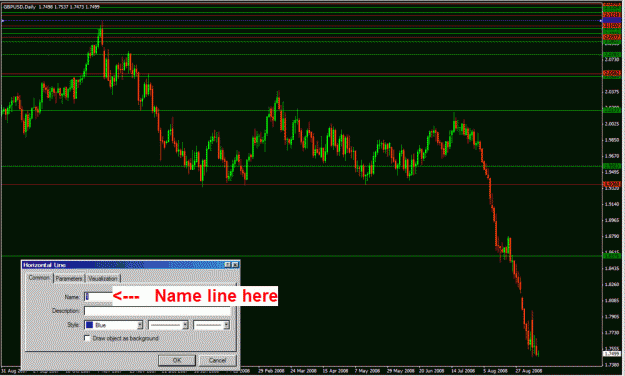
Hey Mouteki I should have mentioned this earlier to make it easier for you, in Metatrader Go up to the Menu bar and click Tools then select Options [ or press Ctrl-O ] Go to the Objects Tab and check Show Properties After Creation. Then the Fib ...
New Mouteki Method...
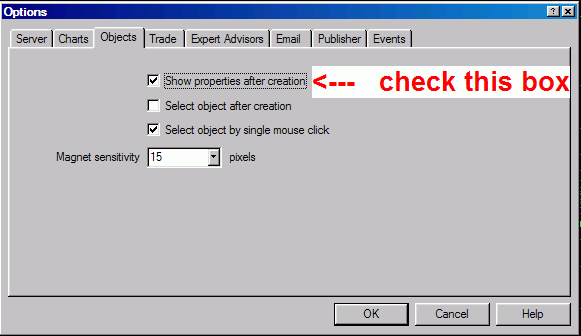
- deanz replied Sep 11, 2008
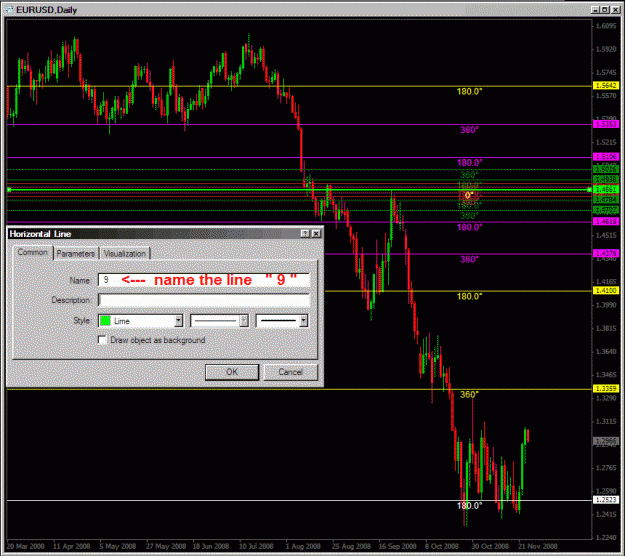
indicators — Here is my hacked versions of grAgol4 indicators. Thanks grAgol4. For indicator fib_seq-2decimal_1 place a horizontal line on the high or low you want to use as point 0 and name the line 1 it will draw fib zones both above and ...
New Mouteki Method...