- Search Crypto Craft
- 21 Results
- danielabas replied Apr 28, 2011
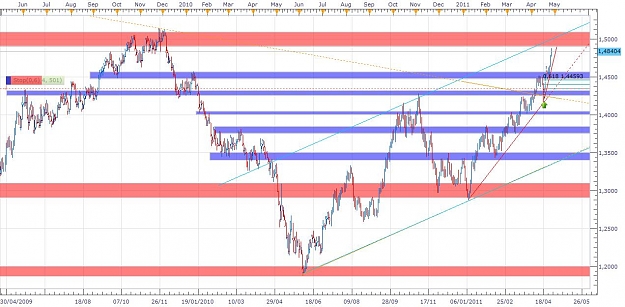
exit — hi dan, here is eur usd chart, should we exit at around 1.5000 (red area) or we wait again? image
DanUK's Advanced Trend Trading Strategy
- danielabas replied Apr 21, 2011
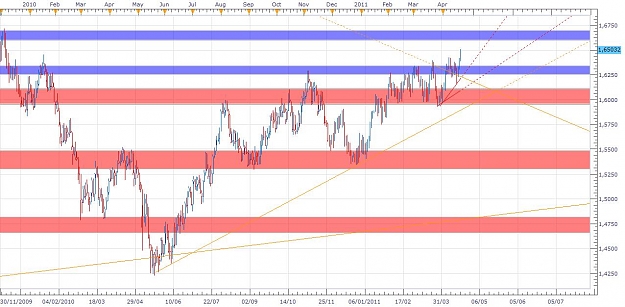
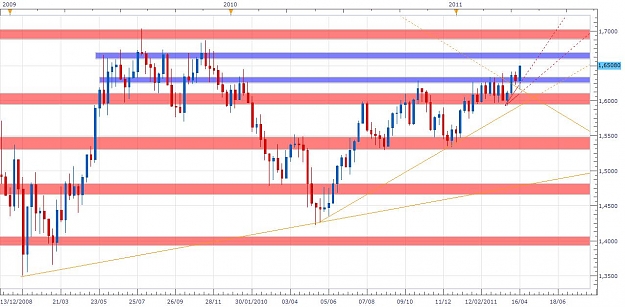
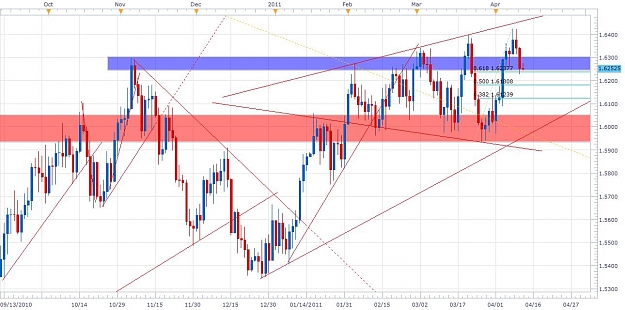
GU bigger picture — gu will reach 1.6600, if GU break S/R around 1.6600(blue area), it will reach 1.69-1.7 major S/R (red area) here is the chart image image
Cable Update (GBPUSD)
- danielabas replied Apr 13, 2011
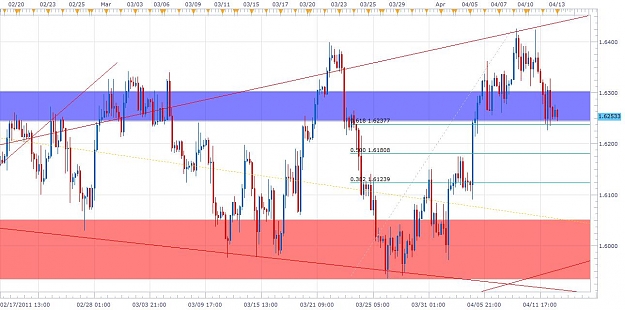
Flat — i see no sign of bullish until now here is the chart image image
Cable Update (GBPUSD)
- danielabas replied Feb 16, 2011
support and resistance — hi Dan, i have read this thread and this is a very nice thread
DanUK's Advanced Trend Trading Strategy i have a question for you, i'm wondering why don't you use pivot weekly or pivot monthly as your pivot and s&r level instead of drawing it manually? ...
- danielabas replied Oct 28, 2010
this is the latest chart of h4 and d1, 1.5964 is important resistant, i will wait to see the pa for the next hours it is broken or rejects the candles good luck image image
Cable Update (GBPUSD)
- danielabas replied Sep 24, 2010
paw, i'm placing 2 limit orders at 1.5860,sl 1.5880, tp 1.5810 an 1.5780.i see the candles is ascending i wanted to short to, but i'd rather wait.wait for price go near the TL image
Cable Update (GBPUSD)
- danielabas replied Sep 24, 2010
no, long dil, but my sl was touched, and still long again after that dil.... 5686, tp 5726 and, 5689 tp 5749.i didn't know my 5749 is going to be touched or not because it's above the resistant, but according to this chart below perhaps it will be ...
Cable Update (GBPUSD)

- danielabas replied Sep 24, 2010
Elliot wave — hi everybody, i want to share u what i see.... the chart seems forming a very nice elliot wave pattern.and now the price seems to form 4th wave of 3rd bigger wave.if 4th wave make HL i guess she will be heading to 5/3(bigger ...
Cable Update (GBPUSD)
- danielabas replied Sep 24, 2010
my long — at m15 chart, the previous candle was closed above pivot, and the minor trend is up as show on chart (aqua color). image
Cable Update (GBPUSD)
- danielabas replied Sep 22, 2010
today opening price — today gu is opened just above today pivot point. image
Cable Update (GBPUSD)
- danielabas replied Sep 22, 2010
bullish flag — i see bullish flag for GU.if the price breaks 1.5716, then the target price will be around 1.5844.here is the charts what do you think guys? image image
Cable Update (GBPUSD)
- danielabas replied Sep 8, 2010
bearish — i see bearish, here is the chart image
Cable Update (GBPUSD)
- danielabas replied Sep 7, 2010
no sign of bullish — here we are, i see no sign of bullish until now, but i'm not going short until it breaks 1.5323. image image
Cable Update (GBPUSD)
- danielabas replied Sep 6, 2010
go long — i'm pending order at 15325, tp at 1.5425 sl at 1.5300 image
Cable Update (GBPUSD)
- danielabas replied Sep 2, 2010
yeah i agree with you,i don't dare opening position right now, the triangle really makes me sick......
Cable Update (GBPUSD)
- danielabas replied Sep 1, 2010
i go short at 1.5464 tp 1.5414 sl at 1.5479. i go short for retracement to 50%. it seems GU cannot go up at 61.8%(38.2) retracement, and i think it will bounce back for a while, so i tp at 50%retracement. i see GU often retrace 61.8% - 76.4%. image
Cable Update (GBPUSD)
- danielabas replied Sep 1, 2010
this is the reason we are buying, the chart bounce back at 61.8% retracement.my target is near middle line at the 4hr chart. image
Cable Update (GBPUSD)
- danielabas replied Sep 1, 2010
gap — london will give more pips of course.... tp at 5402, there is a gap at 1min chart, im waiting the gap is covered image
Cable Update (GBPUSD)