- Search Crypto Craft
- 70 Results
-
 daengrani07 replied Mar 9, 2022
You didn't post iTrend indicator needed by this ea file image image
I will code your EAs and Indicators for no charge
- daengrani07 replied Mar 8, 2022
I really don't like to edit someone code, make me dizzy I hate to many lines on chart, noone really use it all of them, honestly. Just for entertaining eyes only with many lines, or many indis on chart (8-10), nobody really use them all. People just ...
I will code your EAs and Indicators for no charge
- daengrani07 replied Mar 8, 2022
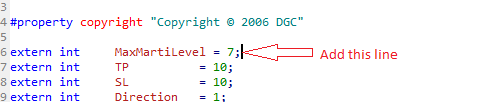
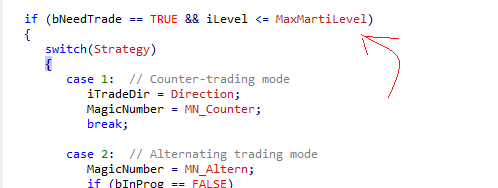
i will re-checked it later OP level & Martingale Level could be count in different way. I have to code ot from scratch.. Try to explain what you really want for marti, I called it Cycle (my term) OP1 --- Loss 10 pips (trailed) OP2 --- Los 25 pips ...
I will code your EAs and Indicators for no charge
- daengrani07 replied Mar 8, 2022
Have you tested it? EA in that post I prefer mt5 image image image image
I will code your EAs and Indicators for no charge
- daengrani07 replied Mar 7, 2022
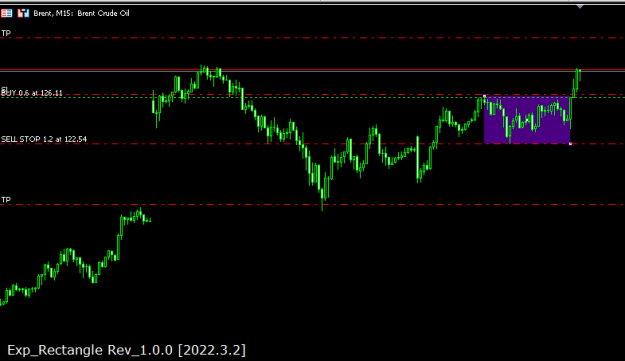
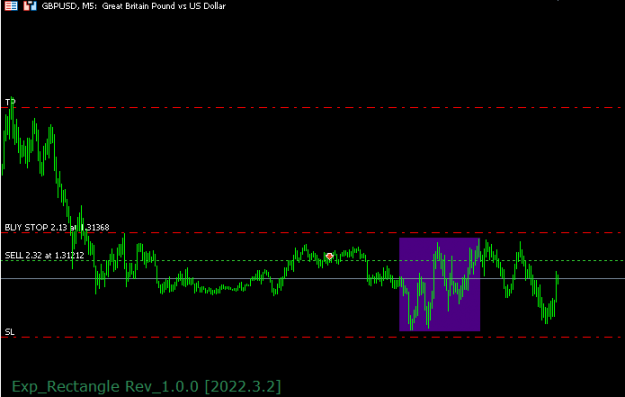
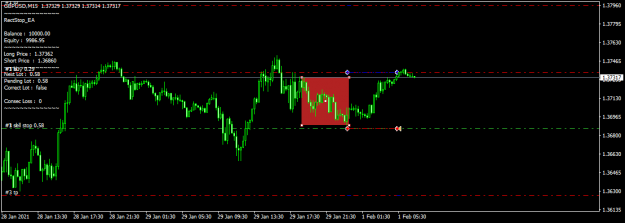
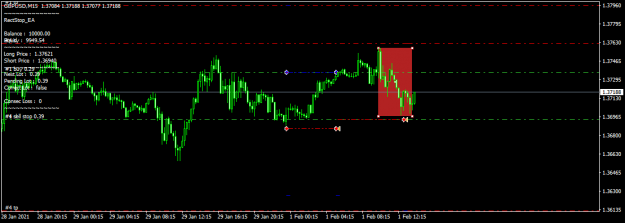
This is better, using rectangle. Manually drag, file image image image image I tried probably all combinations of this logic. The most safest is pick high & low (market structure) to trade breakout (Stop and reverse).. i've tried hundreds of ...
I will code your EAs and Indicators for no charge
- daengrani07 replied Mar 7, 2022
file BackGround color : clrIvory image BackGround color : clrWhiteSmoke image
I will code your EAs and Indicators for no charge
- daengrani07 replied Mar 7, 2022
i don't know what do you mean what candle you are using as for H Line ? i see that y're using last candle What color is this background? file image image
I will code your EAs and Indicators for no charge

- daengrani07 replied Mar 7, 2022
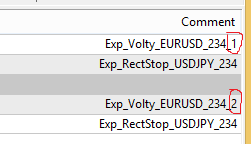
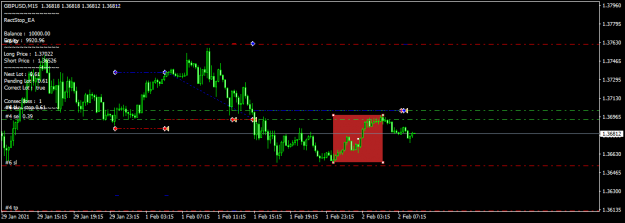
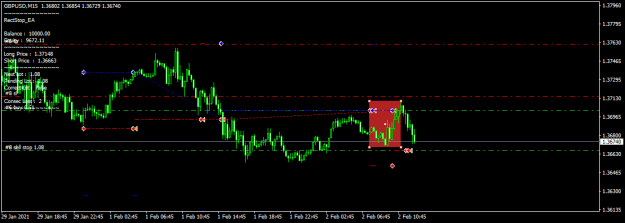
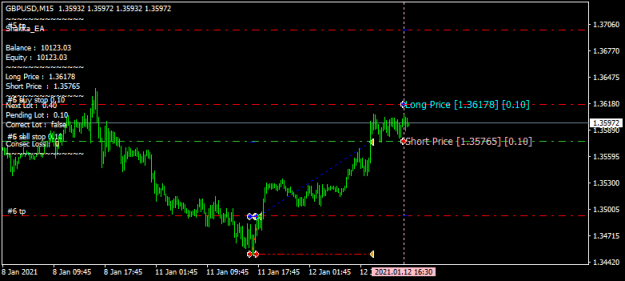
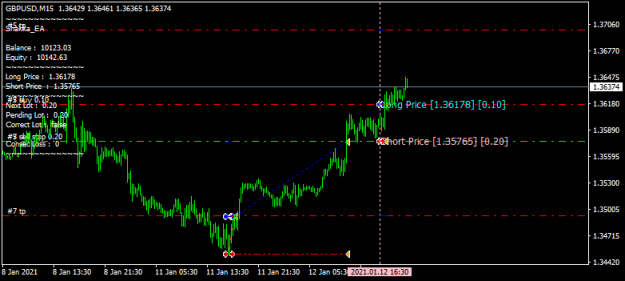
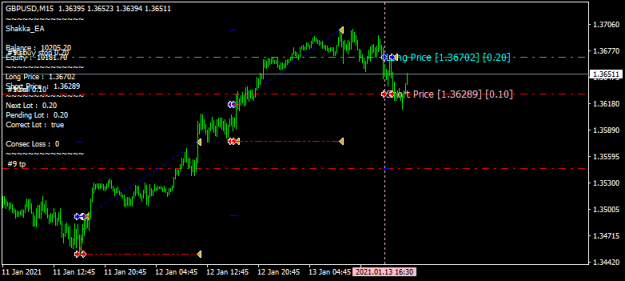
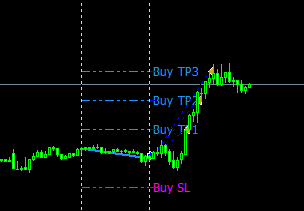
see those lots change,
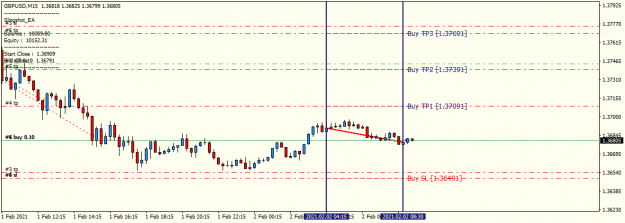
I will code your EAs and Indicators for no charge If TP was reached, remain Stop Order will be deleted file image image image image
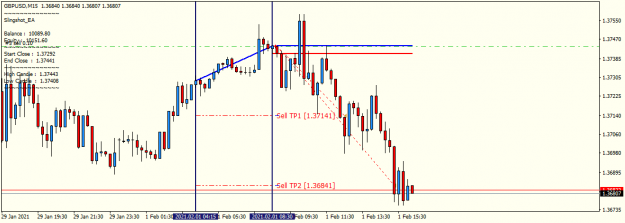
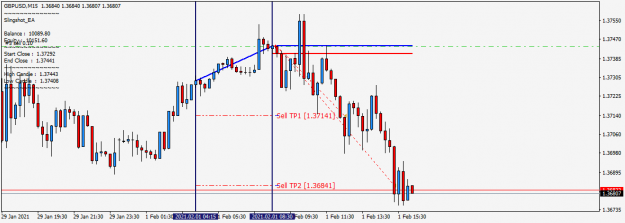
- daengrani07 replied Mar 7, 2022
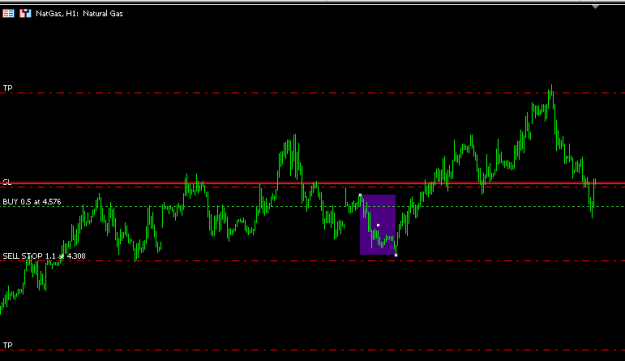
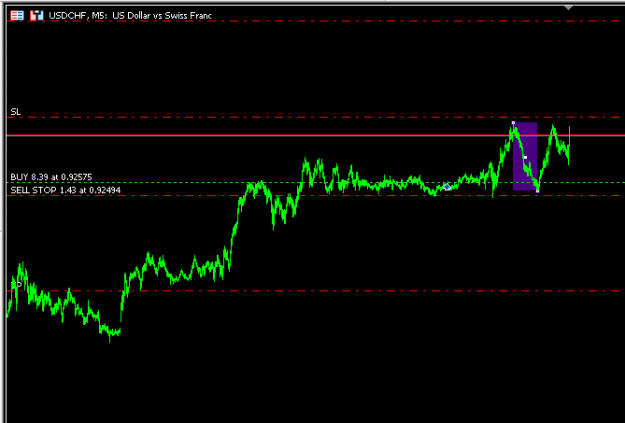
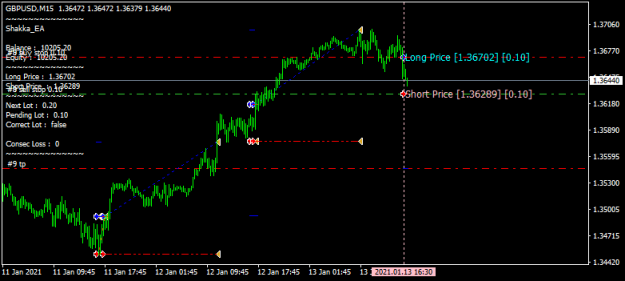
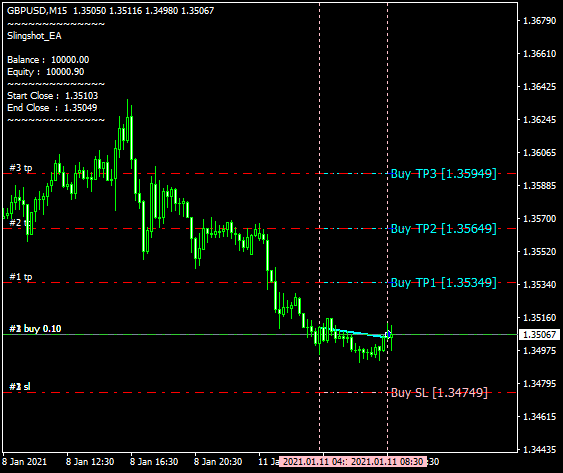
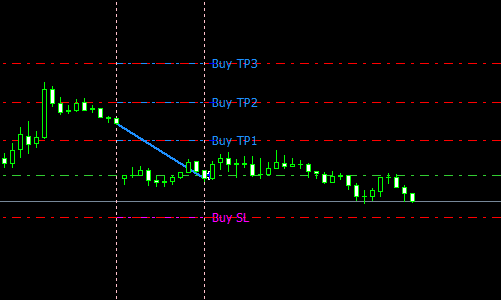
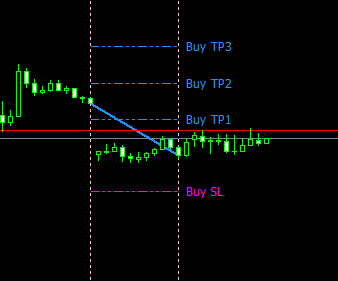
As picture below, it reach TP (Risk Reward Ratio 1:2) 2 cons. days file image
I will code your EAs and Indicators for no charge
- daengrani07 replied Mar 7, 2022
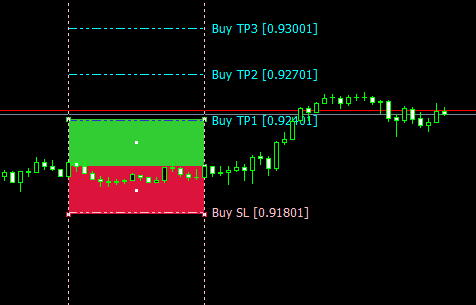
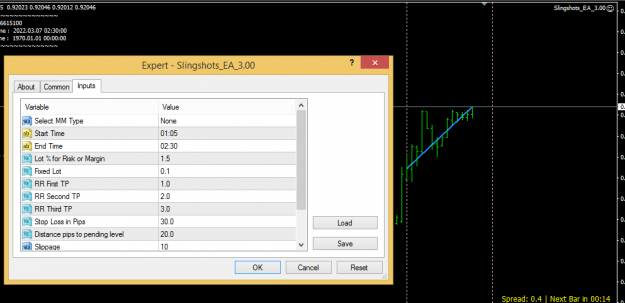
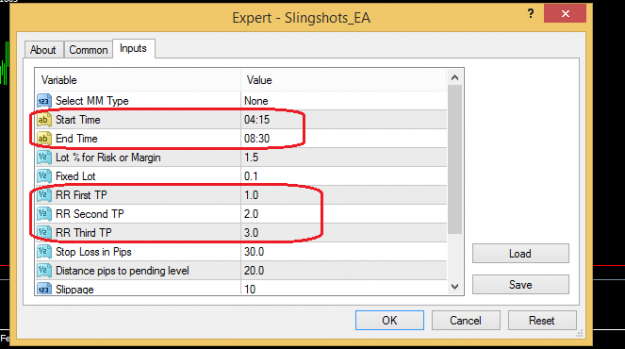
i plan to add these boxes, like tradingview..
I will code your EAs and Indicators for no charge image i just don't know what colors will be good
- daengrani07 replied Mar 6, 2022
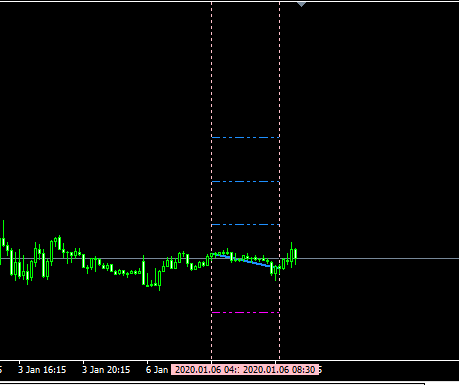
image StopLoss level & TP Level will be displayed on close candle at End Time Line Because we dont know yet where it close. Those levels will always move Up/down if we draw it before candle close on End Time
I will code your EAs and Indicators for no charge
- daengrani07 replied Mar 6, 2022
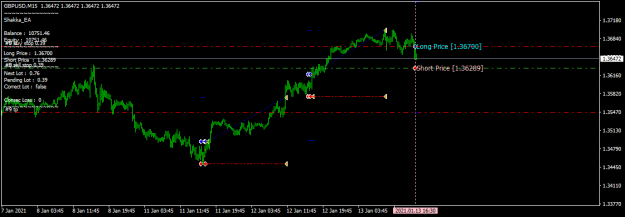
Updated file yesterday sell closed on today's buy sl image
I will code your EAs and Indicators for no charge
- daengrani07 replied Mar 6, 2022
test it file image image
I will code your EAs and Indicators for no charge
- daengrani07 replied Mar 6, 2022
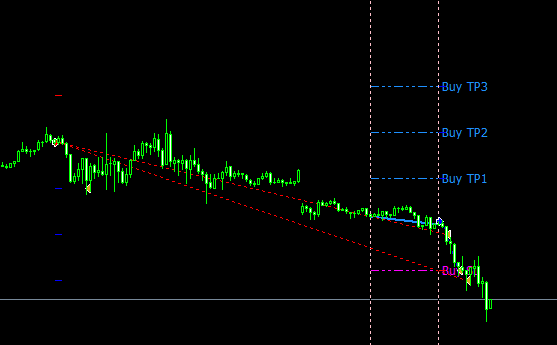
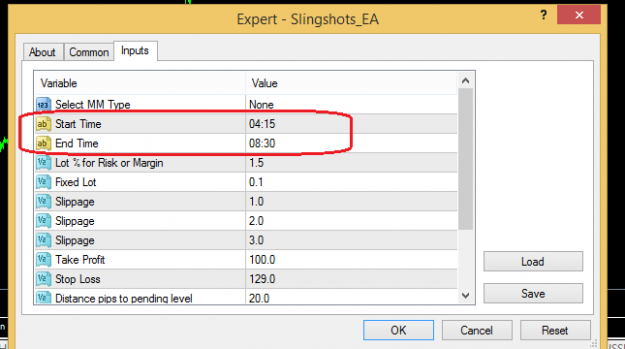
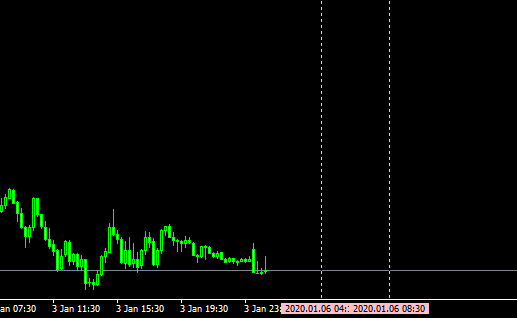
This is easy, what graphic would we draw on chart? How about this? Click this image to see it's animation. This Blue trendline have 2 ends, close price on 4:15 & close price on 8:30. And the rest part will be easy. image i put 2 inputs for start ...
I will code your EAs and Indicators for no charge
- daengrani07 replied Mar 5, 2022
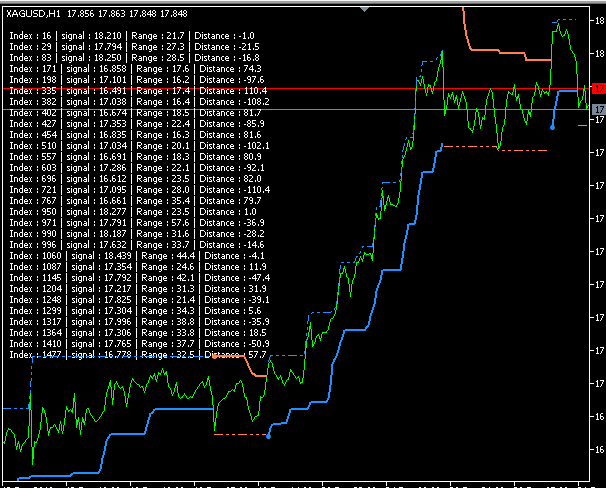
For auto-calculation, it could use array. For example, MA cross. We could spot the timing & use it We could calculate signal to signal range with array. So, before test it with an EA, we already know average range from signal to signal this is an ...
I will code your EAs and Indicators for no charge
- daengrani07 replied Mar 5, 2022
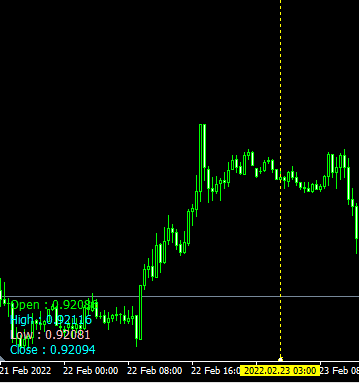
this is an indicator, use above script for drop signal line file below is an EA, it doesn't need newtick to work because i put it at OnChartEvent() function. The OHLC values will change whenever you move the signal vertical line file just see ...
I will code your EAs and Indicators for no charge
- daengrani07 replied Mar 4, 2022
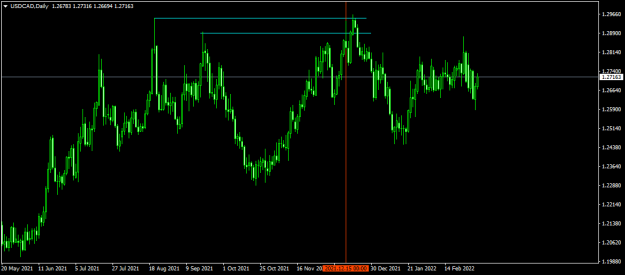
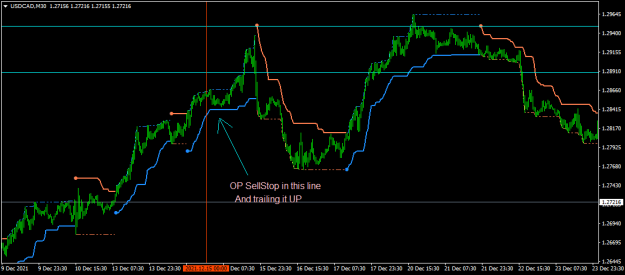
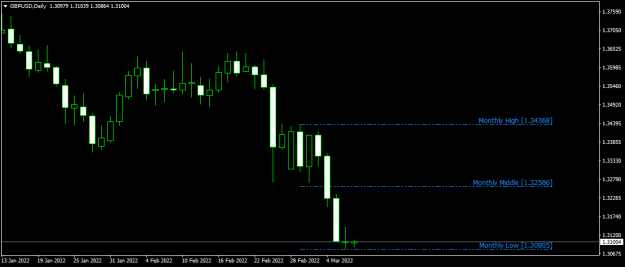
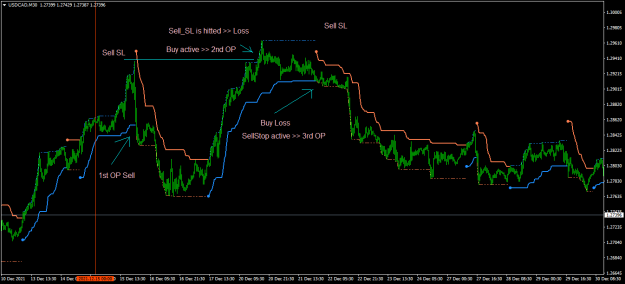
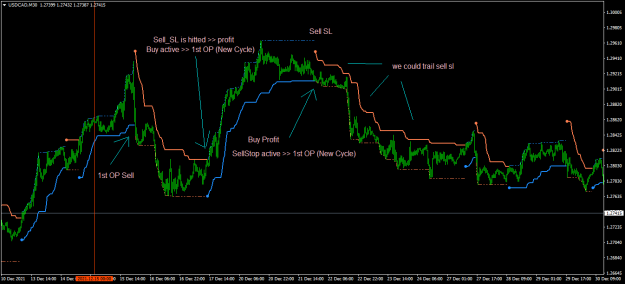
Another example. On Daily TF, USDCAD touch last previous High, and attemp to reach Next Prev High image Then, if we switch to lower TF (H1, M30 or M15) we could OP_SellStop image It could combined with Harmonic. So we know when to start trail & ...
Let's talk about Stop And Reverse