- Search Crypto Craft
- 935 Results
-
 clockwork71 replied Nov 6, 2019
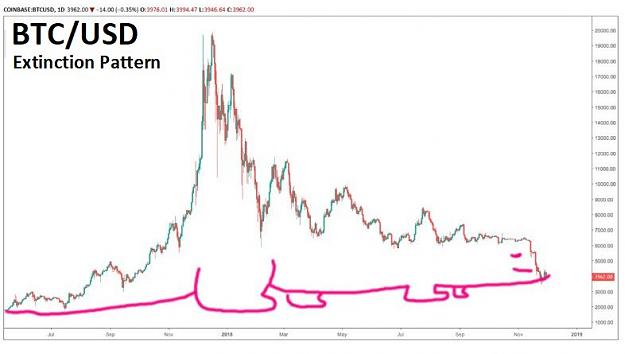
So what you expect us to believe is that some random Mexican retail trader knows more than the large firms. Makes sense. You knew that, I knew that, and so did anyone else. (It was baked into the price.) I am a technical analyst, and therefore call ...
Silent Service Method
- clockwork71 replied Sep 24, 2019
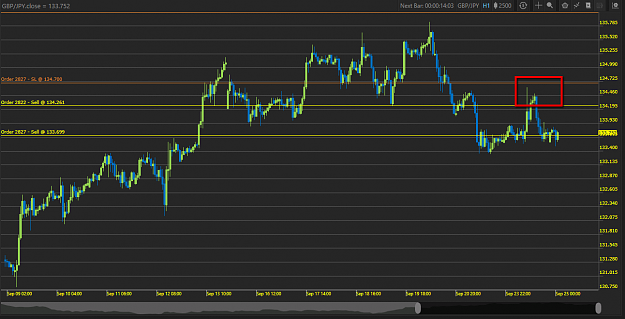
Anyway, back to the adults. So here is the chart I was working with mallee. The GBP/JPY has done better than the GBP/USD pair to the downside, as there is more of a global aspect to the pair instead of being influenced by whatever shenanigans the ...
Silent Service Method
- clockwork71 replied Aug 19, 2019
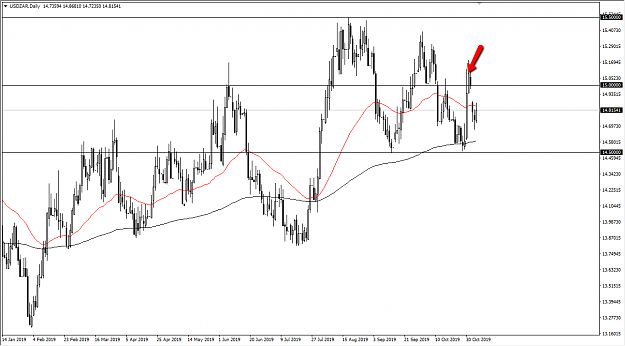
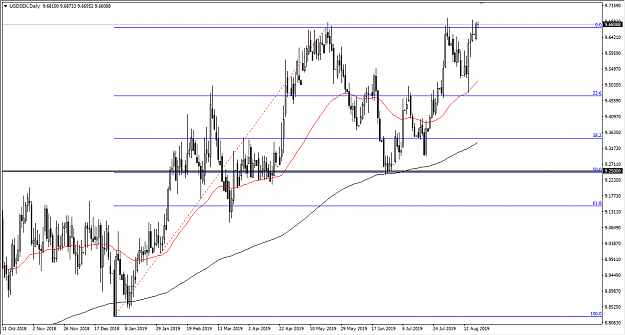
Interesting chart, and an indictment on just how strong the USD is right now. This is the USD?SEK pair. (Swedish Krona, and yes - its reasonably traded, its the smallest part of the US Dollar Index.) We are ready to test the 9.7 SEK level, which ...
Silent Service Method
- clockwork71 replied May 8, 2019
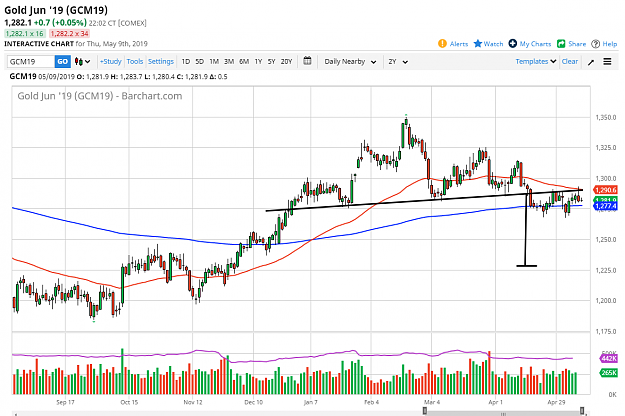
That's an excellent chart to be honest......here is a fun one as well: image Head and shoulders. Formed a pinbar at the neckline today. I will be watching gold...
Silent Service Method
- clockwork71 replied Apr 21, 2019
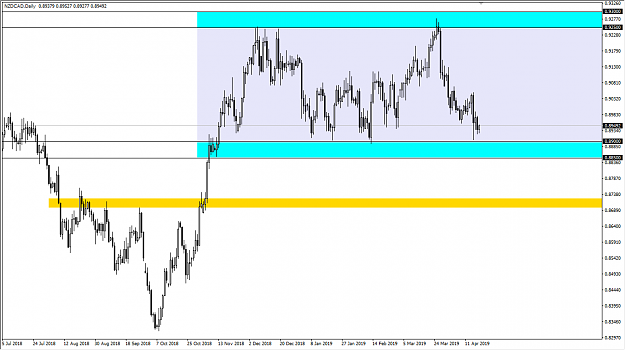
I like this set up. Why? Not only is it an obvious one, but it also offers a relatively clear trade if your initial trade doesn't work out. Sometimes, you are paying for information. I will take a long position based upon the support range below, ...
Silent Service Method
- clockwork71 replied Mar 31, 2019
Sometimes, you need to be ruthless. While a lot of times you hear that money management is critical, I would be a lier if I told you I always followed this. While I hesitate to say this, there is something rather important to be gleaned from this ...
Clockwork 71's Psychology Thread
- clockwork71 replied Mar 23, 2019
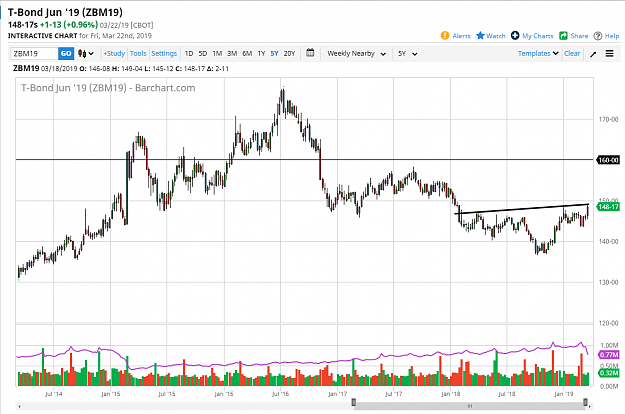
So, here is an interesting chart. 30 year bonds...inverse head and shoulders? That's really bad for stocks typically. image If that's the case, it should be good for the USD.
Silent Service Method
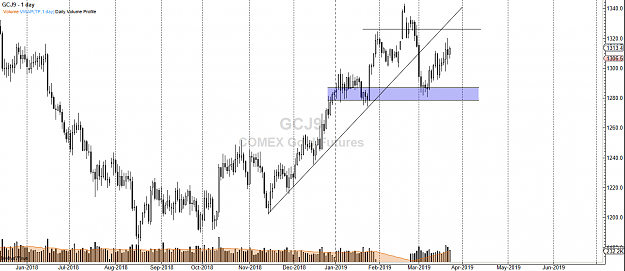
- clockwork71 replied Mar 23, 2019
I think you are correct, eventually. However - I think that in the short term we are looking at consolidation between 1300 and 1325.....as per this chart: image Of course, I reserve the right to be wrong, and full of shit.
Silent Service Method
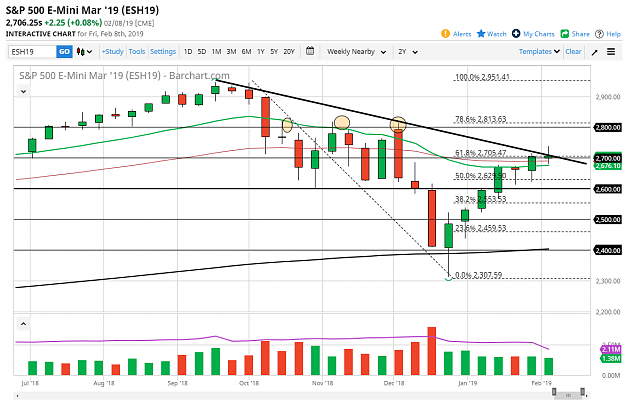
- clockwork71 replied Feb 9, 2019
Looks like business could be picking up. There are so many issues out there, this is going to be a major test of the will of traders. The 61.8 and a shooting star isn't an accident w/ US-China going on, and the Govt. closing seems to be a foregone ...
Silent Service Method
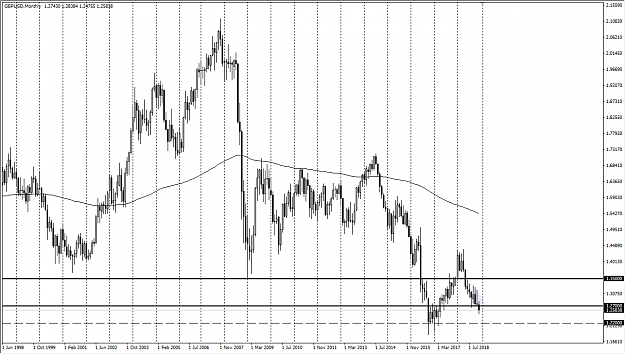
- clockwork71 replied Dec 14, 2018
Why fight the market? image The reason I attached the British pound chart to this post is to give you context as to what I'm talking about. I don't know when you're reading this, but the lesson lies true regardless of what market or year you were ...
Clockwork 71's Psychology Thread
- clockwork71 replied Dec 1, 2018
Why exit a position? There needs to be a reason. I think one of the biggest issues that I ever faced was how to exit a trade. While most systems or educators can tell you how to enter a position, the exiting of the position is much more difficult. ...
Clockwork 71's Psychology Thread
- clockwork71 replied Nov 20, 2018
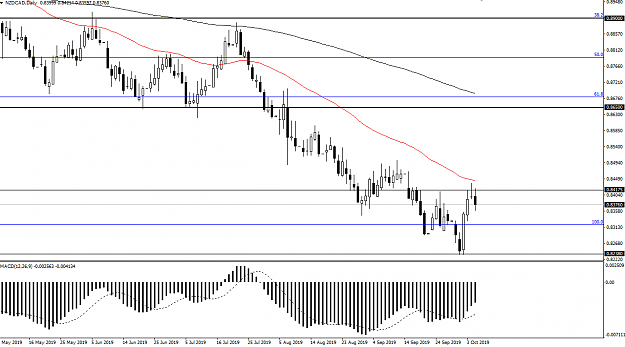
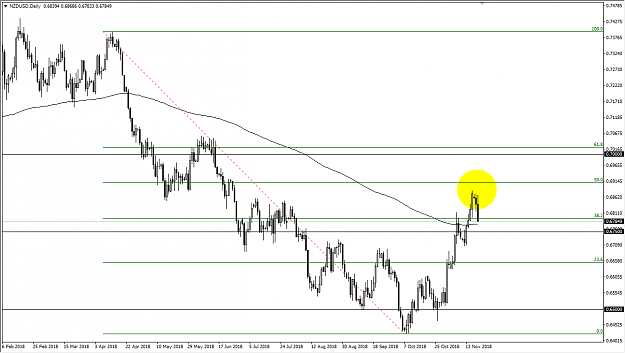
I think that the NZD/USD pair could be interesting. The 200 day EMA is just under, and we formed an ugly bearish candle. If we break below and close below that 200 EMA, then this pair falls significantly. I suspect that's the case, and we have seen ...
Silent Service Method
- clockwork71 replied Nov 20, 2018
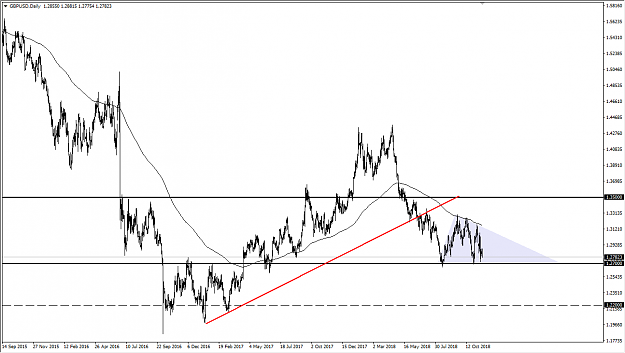
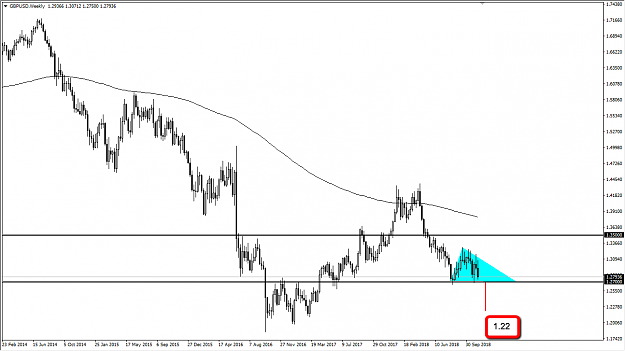
There is still no reason to think we are bouncing. The last couple of days have seen more selling. 1.22 makes a lot of sense based upon the triangle... image
Silent Service Method
- clockwork71 replied Nov 15, 2018
My current gbp/usd chart: A triangle, if we break 1.27 - 1.22 is roughly the target.... image
Silent Service Method
- clockwork71 replied Nov 11, 2018
The Red Wings? That's too bad. :-) Anyway, yes the psychology of a trade is the more important aspect to pay attention to. The ability to trust yourself and your system/analysis is the most important thing to master in my opinion. Take a look at ...
Clockwork 71's Psychology Thread
- clockwork71 replied Aug 19, 2018
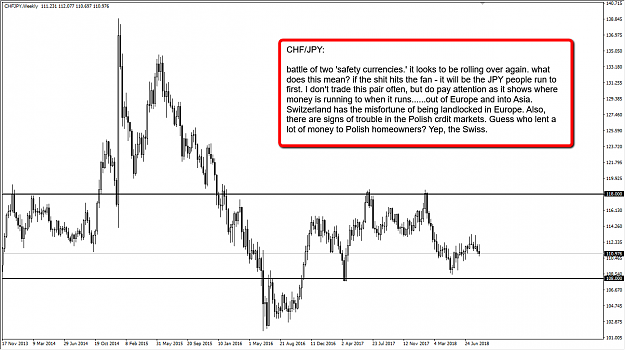
An indicator I use. CHF/JPY weekly - its always nice to know where to run to if there is trouble. image
Silent Service Method
- clockwork71 replied Aug 19, 2018
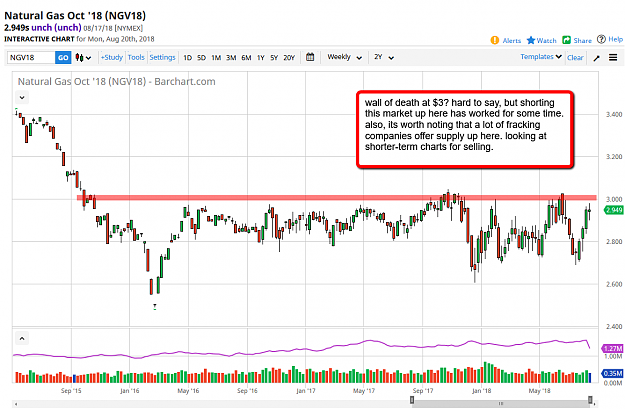
I also am waiting to pound the hell out of natural gas........patience has been key. weekly chart: image
Silent Service Method