- Search Crypto Craft
- 21 Results
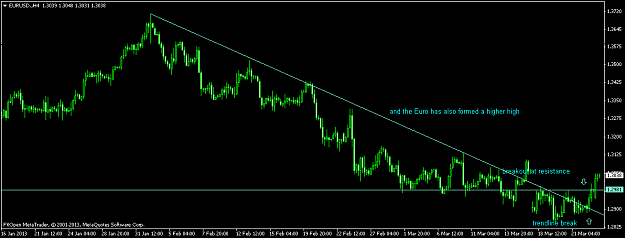
- clambill replied Mar 25, 2013
Let me see if I still know how to upload a pic... WHOOPS! DAMMIT! IT'S A HIGHER LOW NOT A HIGHER HIGH. LOL
EURUSD
- clambill replied Sep 30, 2012
You might have a way better understanding than me on trendlines and moving averages, but the Parabolic SAR during a strong trend can draw you a more "realistic" trendline because it curves with the price action.
EURUSD
- clambill replied May 19, 2011
lol, yes my quirks will make people wonder. It's better than people not expressing what they want to say. Anyway, let's look at this. Here the RL is relative low and RH is relative high. Each RL marked on the chart is higher than the last one. And ...
EURUSD
- clambill replied Aug 11, 2010
I'm still not happy they won't let me change my username but anyway, here's a chart with some trendlines.
EURUSD
- clambill replied Aug 10, 2010
I'm still not happy they won't let me change my username. Anyway, here's a chart with Andrews Pitchforks and trendlines.
EURUSD
- clambill replied Aug 10, 2010
I'm still not happy they won't let me change my username but anyway, here's a short term fib level on the EUR/USD.
Backing Trades Thru Charts
- clambill replied Aug 1, 2010
I'm still not happy they won't let me change my username. I'm usually in the Euro thread but I made this chart because it's so droolicious.
Cable Update (GBPUSD)
- clambill replied Aug 1, 2010
I'm still not happy they won't let me change my username. But anyway, here's some delicious charts you can drool on.
EURUSD
- clambill replied Jul 31, 2010
I'm still not happy they won't let me change my username. Anyway, I'm still learning how to use lines so I guess I should not attempt to "correct" someone's lines. But, this is my interpretation. I believe if there's no reaction to a line, then it ...
Backing Trades Thru Charts
- clambill replied Jul 29, 2010
I'm still not happy they won't let me change my silly username but I'm going to try to resurect this thread because it's impressive. I'm posting here a chart with Andrews Pitchforks and a resistance line from a previous daily high at 1.3097.
Backing Trades Thru Charts

- clambill replied Jun 27, 2010
ATR — Does anyone here look at Average True Range? I just want to confirm that these days are less volatile. If you switch from 4 hour to daily does it skew the results a lot?
EURUSD
- clambill replied Jun 23, 2010
You'll find my daily chart a little comical but if you look at each indicator seperately, then it doesn't look too complicated. When I looked at various fib levels and noticed a lot of them around the same highs and lows, I simply put horizontal ...
EURUSD
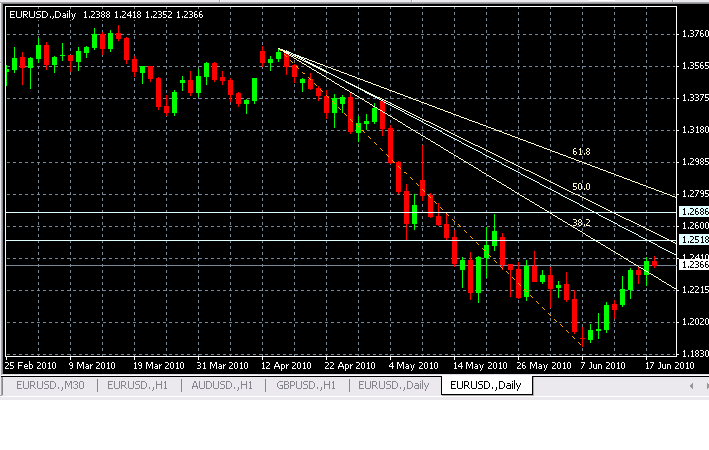
- clambill replied Jun 18, 2010
I'm going to try posting a chart here to show a Fib fan, trendline and resistance levels (that were actually close to a bunch of Fib levels). image url EDIT: Dammit! Where are the instructions to post charts?
EURUSD