- Search Crypto Craft
- 43 Results (2 Threads , 41 Replies )
-
 blueruby replied Apr 11, 2019
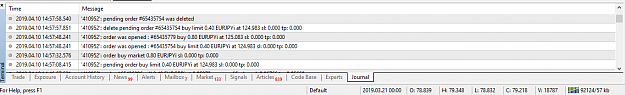
Wow, thanks for that info. What's the best way to record trading session / screen activity? Well, maybe not the best, how about the lowest cost? Here's the tab. Looks like it took about 40 seconds to open my pending (buy limit) order. In the ...
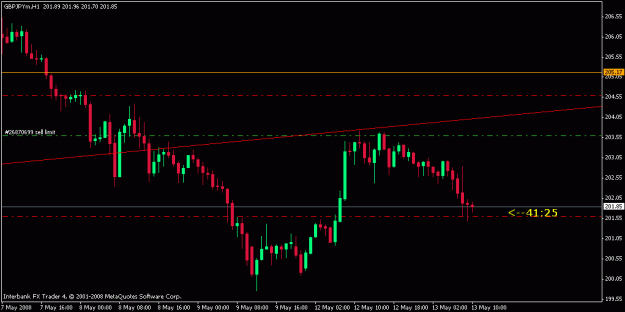
Tradersway playing tricks
- blueruby replied Jun 3, 2008
I just got up and here's what I see. Will they run the stops one more time today? Buy now? 50 pip stop or put it below support? Usually if the E/U goes against you 50 pips, you're wrong. Or, limit order near or below support? I think I'll try both, ...
Stop Hunting Strategy
- blueruby replied May 22, 2008
At the left of the chart you have a bounce off support, then another bounce occurs, then on the third, it breaks down, takes out the stops, and up she goes. Then it breaks through resistance, pulls back, goes up, pulls back again (resistance became ...
Stop Hunting Strategy
- Stop Hunting StrategyStarted May 13, 2008|Trading Systems|16 replies

Let's just cut to the chase here. Now that I think about it, I'm surprised I've never seen this on ...
- blueruby replied Mar 19, 2008
Thanks for the welcome. I'm talking specifically about the one breaking down right now. First target is 9800. Excuse me if you've already discussed it, I only read back a couple pages.
Cable Update (GBPUSD)
- blueruby replied Jan 31, 2008
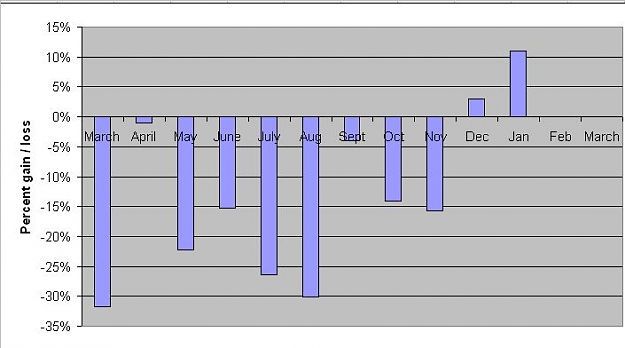
Improving — January started off very well. Toward the end of the month I was getting sloppy and not following my rules as well on a couple trades, and it cost me a little. Nevertheless, I must be doing it right. And, there were a couple that ...
Transition from Losing to Winning
- blueruby replied Jan 7, 2008
The closed candle one is a tough one. I still jump in once in awhile then get "buyer's remorse". In April last year I traded a system mechanically that used MA's, MACD and RSI, that's where I was on May 2. Around mid-May or thereabouts, I abandoned ...
Transition from Losing to Winning
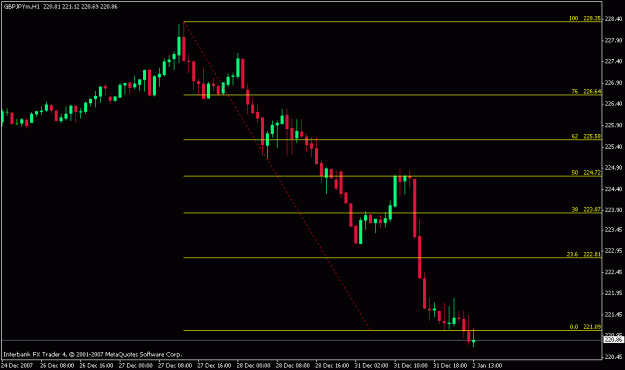
- blueruby replied Jan 2, 2008
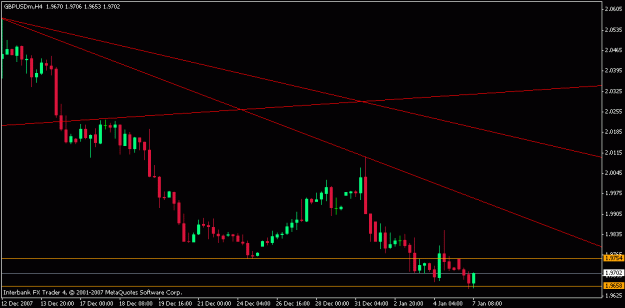
Real time - When is a breach a breach? — How about we talk about what's happening NOW? Last week's low on G/J is 221.26. That has clearly been broken, we have closes across the line. However, we know that S/R levels are +/-. You can find many ...
Indicator Free Trading - Skunny
- blueruby replied Dec 30, 2007
I feel like I'm in the dark as much as anyone, and the more I play with these, the less I believe regarding prediction. They look useful for setting targets, when integrated with what I already do. Sometimes I think I just need lines on the chart to ...
Indicator Free Trading - Skunny
- blueruby replied Dec 23, 2007
See the red arrow. Underneath is the word buy. Under the word are three lines, I have selected the solid one and the white squares have appeared.
VHands Trading Simulator
- blueruby replied Dec 14, 2007
On 12/13 at 09:30 he sells g/j at 228.25. Takes profit on the short on 12/13, 09:55, at 227.80. My chart shows an up move at that time, from right around 227.80 to around 228.25 So, to answer the question in the first post: No. I cannot do it like ...
i doubled 5k to 10k in a days
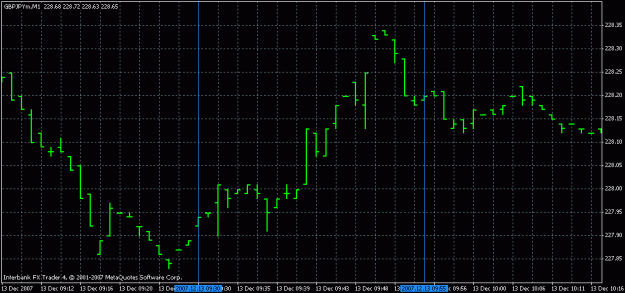
- blueruby replied Dec 13, 2007
There are a number of things that have made the difference, all are the same things we've been told over and over. Mostly it's been picking the "A" trades and passing on the rest. And limiting losses. November was similar to previous months, I would ...
Transition from Losing to Winning
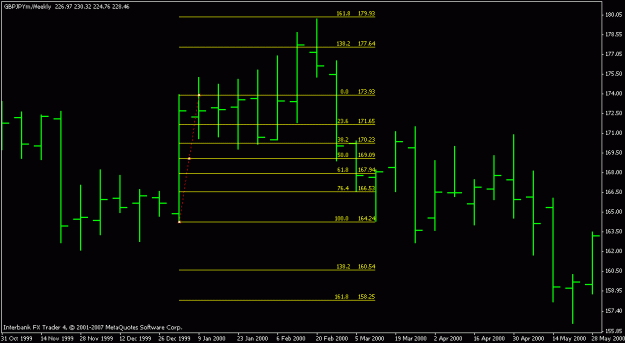
- blueruby replied Dec 13, 2007
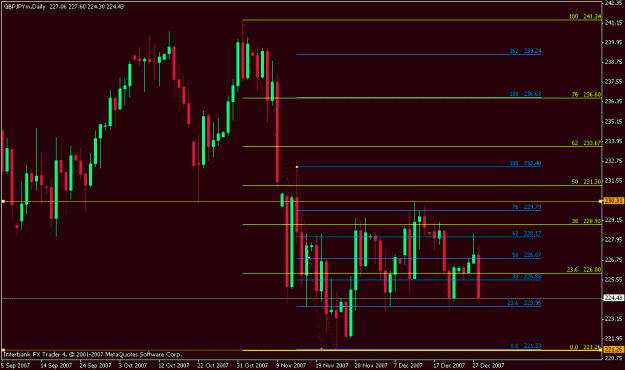
OK, so here's my first one. The G/J, 1/2/2000 weekly candle. Skunny wasn't kidding when he said we could figure it out in a few minutes. See how the candle high was breached. But, neither the 138 nor the 162 extension was hit - that's the condition ...
Indicator Free Trading - Skunny
- blueruby replied Nov 5, 2007
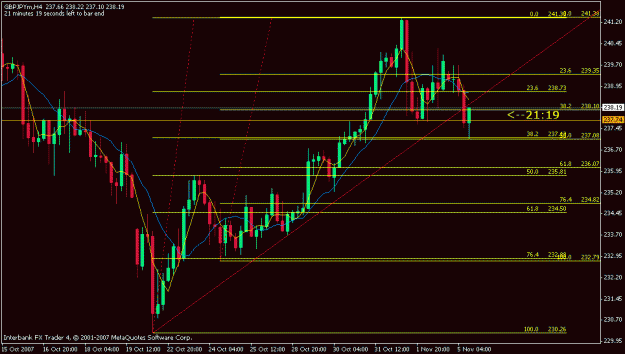
I have to respectfully refer you to page 21, posts 305 and 307 where James says "it's go time". Since I read that, I've noticed more than a few of those "piercing noses", and I'll always take note of them from here on out. Also, if you put fibs on ...
james16 Chart Thread
- blueruby replied Nov 5, 2007
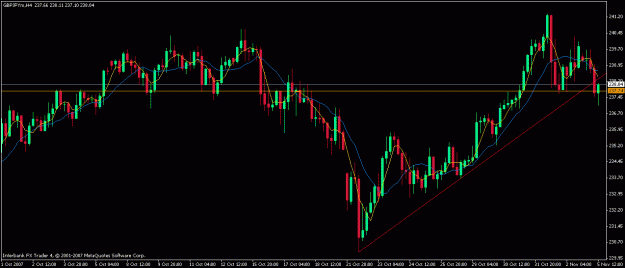
Hello everyone! I've only read about the first 2500 posts on this thread, but so far it's been good stuff. Hey, could that be a pin bar forming on the G/J 4H? It's not a really long nose, but it does poke down below S/R going back to 10/3/07, then ...
james16 Chart Thread
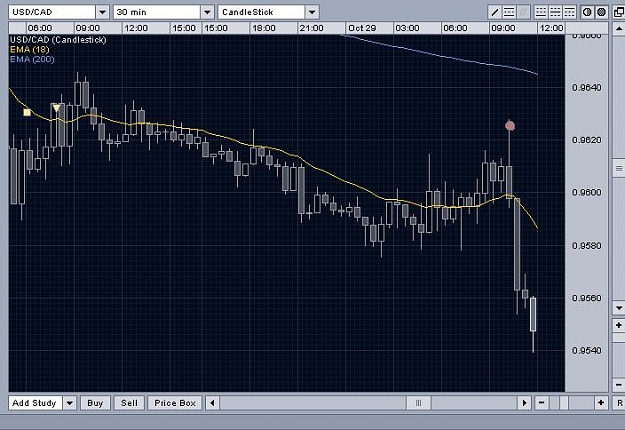
- blueruby replied Oct 29, 2007
Why I hate long term trading — Yes, despite my realization, revelation and edification, I am still trying. In my old Oanda account that's almost blown. Took a short on the cad, one of those "walk away" trades. But, I didn't of course. When I ...
iandekoker's 5 profit target trades
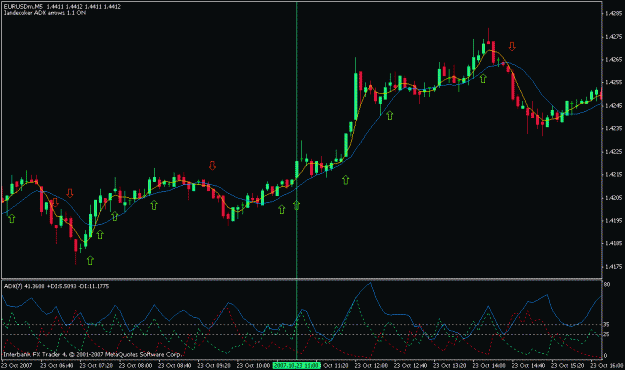
- blueruby replied Oct 29, 2007
I'm still working the 5M EUR almost entirely. When the indicator arrow comes at, or right after, a long candle, I'm cautious. I always LIKE the second arrow in a trend. I double up on those trades. The green arrow at 8:10 on the 5M EUR was right ...
iandekoker's 5 profit target trades
- blueruby replied Oct 29, 2007
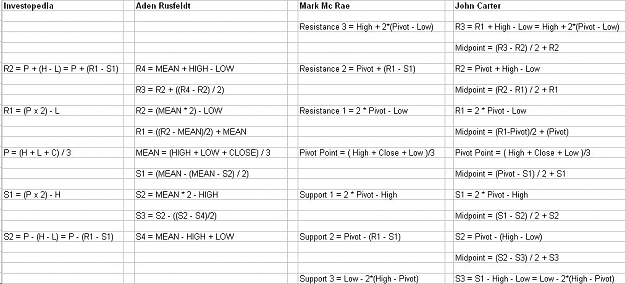
More info. Anything appearing on the same line is mathematically the same.
How do YOU calculate Pivot Points?
- blueruby replied Oct 28, 2007
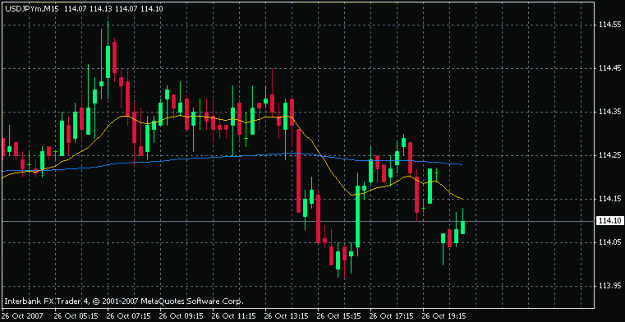
Attached is Interbank's chart. It shows a gap between Friday and today, from 114.21 down to 114.07. Just because they don't open until 18:00, that doesn't mean price wasn't moving. Is it really a gap?
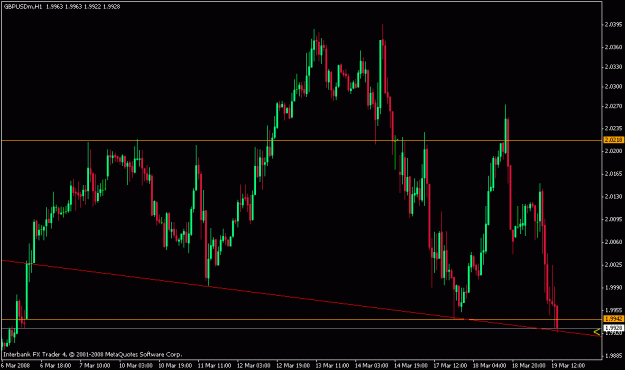
Is it really a gap?