- Search Crypto Craft
- 104 Results (1 Thread , 103 Replies )
-
 behof replied Jun 11, 2019
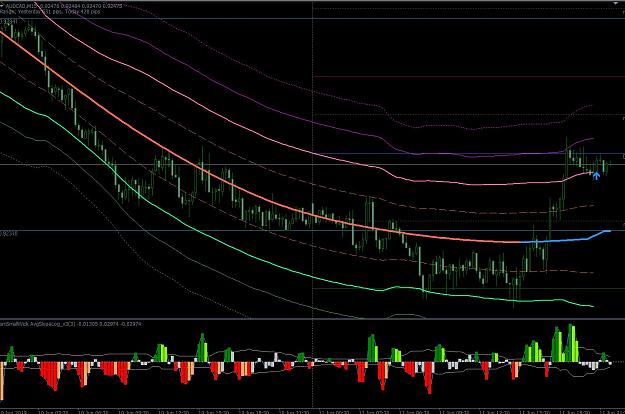
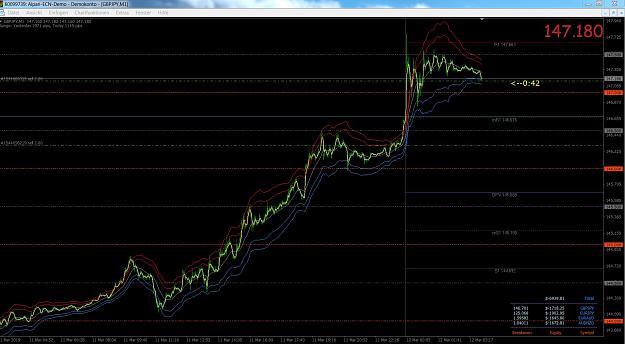
Hi Swingman ! Same on AUD/CAD 15min chart (upper right buy signal).
LazyTMA trading
- behof replied Jun 11, 2019
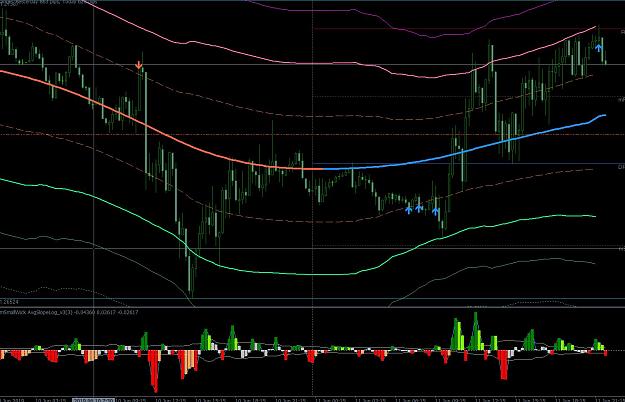
Hi Swingman ! First of all thank you very much for your effort. I just saw a false Buy Signal in the right upper Part of the attached Screenshot on GBP/USD 15min chart. As I understand buy signals are generated below the blue center line and sell ...
LazyTMA trading
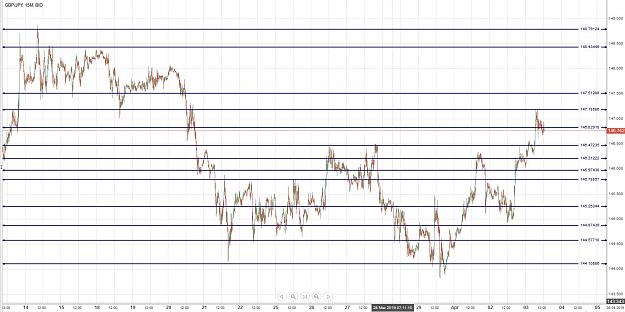
- behof replied Apr 3, 2019
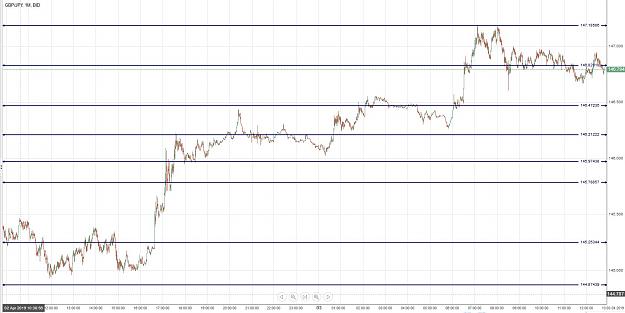
Hi folks ! I just added 2 charts of the GBP/JPY (15min and 1min) and marked the levels of peaks and valleys. The stops can be set very tight. I didn't pay attention to the TMA because as George always said TMA comes last. I think its more clear ...
Price action at the core / tma intra day
- behof replied Mar 11, 2019
Hi George ! What about trading this runner ? It hit the upper pressure zone several times on the way up but never came down much ..
Price action at the core / tma intra day
- behof replied Aug 18, 2018
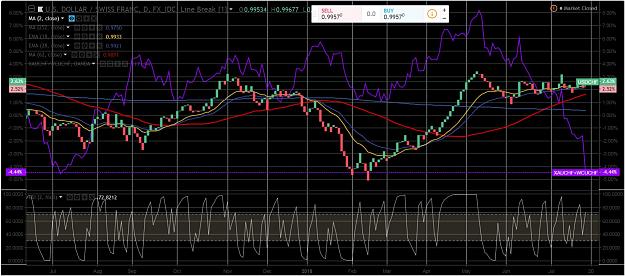
Hi Folks ! A question to Neil. What does the daily USD/CHF chart is telling us now ? USD/CHF going up next week ? The line chart displayed is XAUCHF+WCUCHF combined
(binned per thread starter's request) Currency Strength with cont
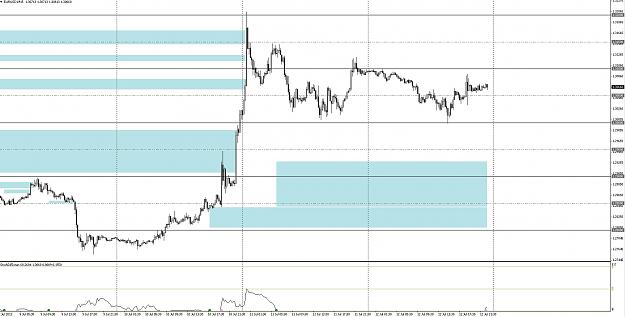
- behof replied Jul 27, 2018
image It's EUR/JPY 1h chart
(binned per thread starter's request) Currency Strength with cont
- behof replied May 29, 2018
What I once read ist that you should trade the opposite of what you think you would like to trade. So if you watch the chart going up you think Wow I'm buying now. But instead one should prepare to sell because the obvious movement is a movement ...
The only thread you will ever need: FX Exposed!

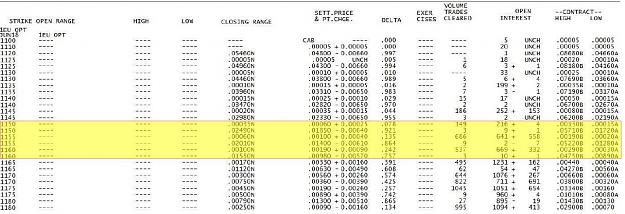
- behof replied May 29, 2018
Hi Folks ! Look at the CME Option Levels of EUR/USD. Its obvious why the EUR/USD went down. The question is how to interpret these numbers. But maybe FF can give his 2 cents.
The only thread you will ever need: FX Exposed!
- behof replied Jan 10, 2018
Hi Ryan ! It's good to see that you try to introduce cryptocurrencies. I like the way you are talking about them. I just want to register on binance.com but unfortunately at the moment they don't accept new clients due to a server overload. ...
The REAL Traders Video Journal, 3-5% per month as a US trader

- behof replied Jul 14, 2013
Hi Folks ! Look at the EUR/USD 15 min chart..... Hmmmm... lets wait and see ;-)) Cheers Bernhard
The similarity system
- behof replied Jul 14, 2013
Hi Folks ! Attached you can find an example of EUR_JPY_15 Min chart with next target zone and trade parameters. Regards Bernhard
The similarity system
- behof replied Aug 12, 2010
How to trade this one ?? — Hi Nanningbob ! I've attached a snapshot of the CAD/JPY 4h chart from March 2010. The pair moved nearly 1000 pips up in a straight direction between the two magenta lines. Could you explain how you would handle this ...
Nanningbob 4h trading system ver. 5.0
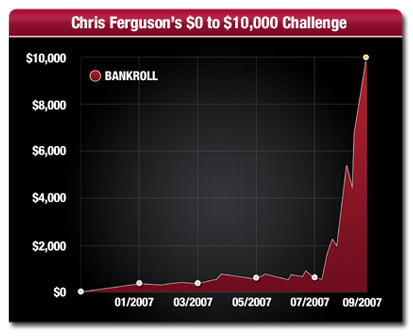
- Some thoughts about Money Management..Started Oct 25, 2009|Trading Discussion|0 replies

Hi Folks ! Today I found an article on the Web regarding a challenge in which professional poker ...
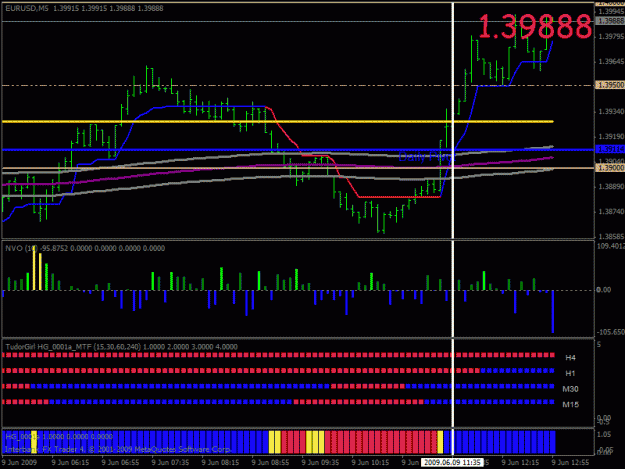
- behof replied Jun 9, 2009
EUR/USD Snapshot — Hi Folks ! Attached you will find an actual snapshot of the 5min EUR/USD chart. The white vertical line marks the entry point. 1. 15min and 30min are blue 2. TG indicator bar switched to blue => Long signal Happy trading ...
EUR/GBP Trendmagic System
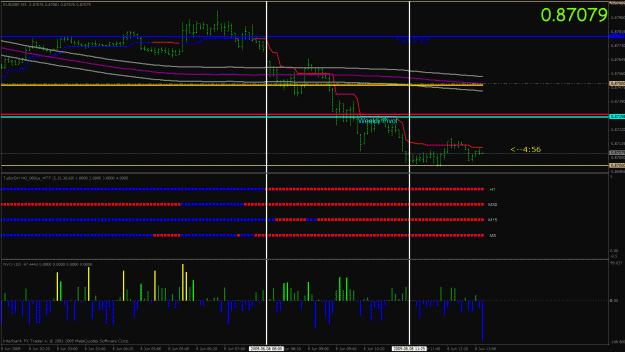
- behof replied Jun 8, 2009
EUR/GBP Snapshot — Hi Folks ! Attached you will find a snapshot of EUR/GBP 5min chart with my trade from today. I bailed out while price touched the 0.8700 number. Very nice system !! Happy trading Bernhard
EUR/GBP Trendmagic System
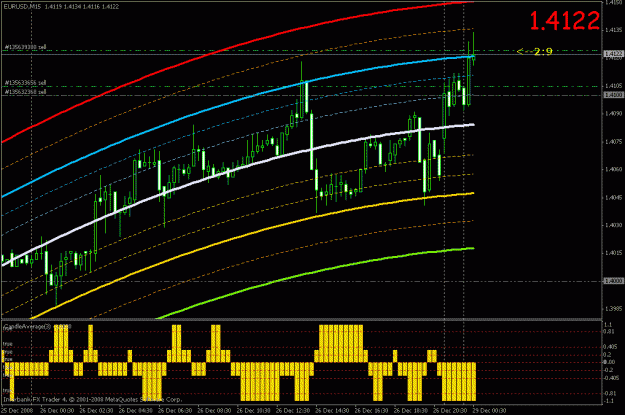
- behof replied Dec 28, 2008
Update EUR/USD — Hi Folks ! Attached you will find a new update of EUR/USD 15min chart. Price touched the blue solid line and I shorted another 0,5 standard lot. I deleted the abha indicator because it repaints to much for me. I think it's ...
My own developed benkyalate system
- behof replied Dec 28, 2008
Update EUR/USD — Hi Folks ! Attached you will find an actual chart of EUR/USD 15min chart. I'm short with 1 standard lot because price went in the top blue zone, candle average is short and we got a short signal on abha indicator. Greetings ...
My own developed benkyalate system
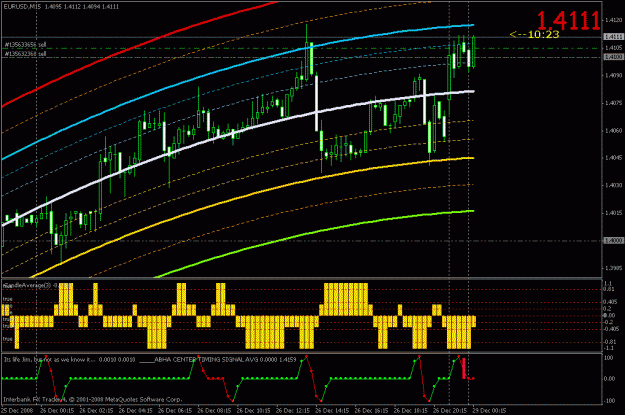
- behof replied Nov 9, 2008
Update GBP/USD 5min chart — Hi Folks ! Now price touched red solid line ! RSI stays oversold Wait for EMA to cross Heiken Ashi down.... Greetings Bernhard
My own developed benkyalate system
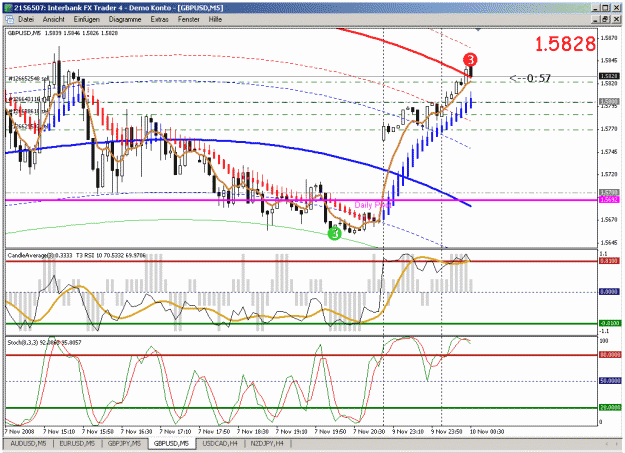
- behof replied Nov 9, 2008
Improvement — Hi Folks ! I hoped you learned something...... As you can see GBP/USD climbed up and I scaled up my lots.... Well that were demo lots to demonstrate that there is something missing... Attached you will find an improved chart with ...
My own developed benkyalate system
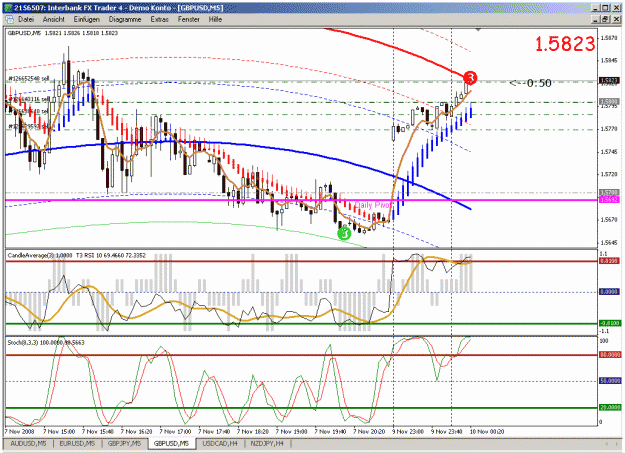
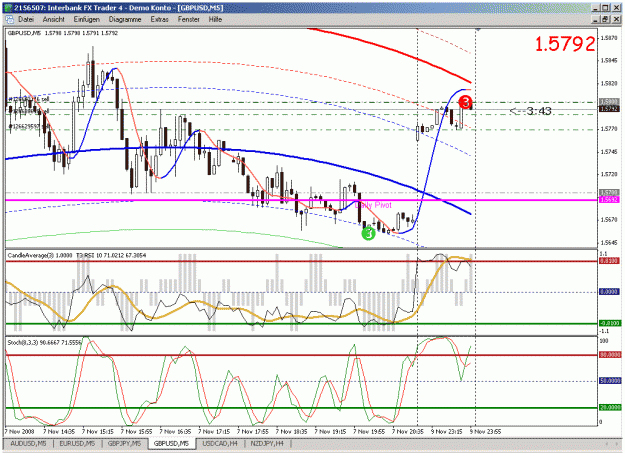
- behof replied Nov 9, 2008
Update GBP/USD 5min chart — Hi Folks ! I've added 3 more standard lots to my GBP/USD short trade because RSI line touched again the red overbought line.. My target will be 1.5700 line => Gap fill Lets see.. Greetings Bernhard
My own developed benkyalate system