- Search Crypto Craft
- 25 Results
- andypips replied Jan 5, 2010
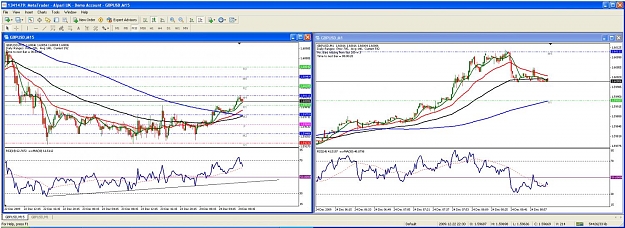
Hi Yourspace. Just a quick look at your chart and some comments if they help. Your line 3(orange on the chart) is drawn under points on the rsi that are not formed by sharp price reversals. The decision as to where to draw them from is hard but can ...
The RSI Trade
- andypips replied Dec 30, 2009
Hi Sreeprakash. I have a few points to make/analyze and please don't be offended if they sound harsh, I do not mean to be rude. I have to point out a few things and hope you take them as they are intended with goodwill. I am sure if I went back and ...
The RSI Trade
- andypips replied Dec 30, 2009
bolly bands on rsi. — Hi Sreeprakash. It's good to see you going through all the possibilities surrounding the rsi and its uses. I feel that the bolly band thing is risky though. Look at this chart for the same time as yours. The touch of the ...
The RSI Trade
- andypips replied Dec 24, 2009
that'll do. — Took 20 on the way down 6006 down to 5986. It now has come to rest on the rsi t/line and the emas.If the rsi can hold below the rsi50 level it may go further. I think it will sit around here for a while now though. I think thats ...
The RSI Trade
- andypips replied Dec 24, 2009
Morning — Morning kareem. Looks like you made your 70 level if your trailing stop didn't kick in first. I got out my cable for 20 as it started to climb back up. Short again now for some quick points back down to this trendline. Will be worth ...
The RSI Trade
- andypips replied Dec 16, 2009
200lwma — hi sreeprakash The 200 lwma does have some touches which give it credibility. they probably show up more clearly in hindsight and when backtesting. I have looked at it on m5 which I trade and h4 which I notice your chart is. I have ...
The RSI Trade
- andypips replied Dec 15, 2009
Hi Stranger — Hi J and K. Glad to see you back Jeremy. I took the trade short for 20 and then 20 long after divergence - see arrows. The difference being I was looking for a break of the lower rsi line compared to your rejection of the upper ...
The RSI Trade
- andypips replied Aug 18, 2009
Hello — Hi Vic Thanks for the thread. I have been reading it and should have been in bed long ago. I traded live from the red line on m1 chart when all the safe conditions were met. bailed out at the pivot line for just under 40 pips. Think I ...
Ichimoku forever
- andypips replied Aug 7, 2009
Hi Danny and Qqe Hope Lizpet doesn't mind , I'll post one explaining what I think He means. Excuse my artwork, it's not the best. I chose H1 on ey and rsi9 as peter trades longer time frames than me. Once over the 80 level on rsi start moving up the ...
The RSI Trade
- andypips replied Aug 7, 2009
Hi BlueBull I will explain briefly but if you need more then pm me as this isn't rsi.(saying that I added a 14rsi with a few line breaks shown on there) I use h/ashi and look for colour change away from sup or res. At the moment I am trading ey only ...
The RSI Trade
- andypips replied Jul 21, 2009
It's the Top 30 german indice containing a high proportion of technical/electronic companies. it closely follows the dow and moves similar to the ftse and french cac40 during europe open.
Silent Service Method
- andypips replied Jul 12, 2009
Hi Edge First trade for 10 points . chart and ac attached. Please tell me , do you wait for any touch/piercing or break of the t/magic line when the other two conditions are met or do you just go for it. Thanks Andy
C4 Scalping
- andypips replied Jul 10, 2009
heres the chart for you k.also attached the two indis and a template.
The RSI Trade
- andypips replied Jul 10, 2009
Hi All. In light of the recent craze for multi coloured indis across the bottom of the screen I didn't want the RSI thread to not have been seen to make some sort of effort. I have attached a chart for your consideration. It uses RSI color indi set ...
The RSI Trade
- andypips replied Jul 7, 2009
Got it. Never more than 9 points down, trade closed for +35. Look how the break of the t/line came down to test the lower/slower t/line and test the 40/60 levels. Check out M3 and pivot point touches. Nice start to the day when you wake up to that.
The RSI Trade
- andypips replied Jul 6, 2009
Hi Peter Thanks for the suggestion. I have spent months with bb and rsi and it just doesn't seem to be my perfect partner. I sometimes drop it on and also used a bbsqueeze indi for a while. I have john bollingers book and also subscribe to his free ...
The RSI Trade
- andypips replied Jul 2, 2009
I got out of this for +12 short as it seemed greedy to go for more at this hour but just drew the rsi t/line on and realise this could be a big move if it holds. Coming up to 1.4000 though. lets see.
The RSI Trade
- andypips replied Jul 2, 2009
Don't blame me if you're just a sucker for the rsi. It just fits in that space at the bottom of the screen so well. Just got 12 short on eu on m5 down through the rsi 14 50 line.(see chart) Hit my limit last night at 1.4113 for 77 pips.(previous ...
The RSI Trade
- andypips replied Jul 1, 2009
HI K/J/Lizpet A nice tap down from this upper t/l coinciding with the 70 line and divergence, then a breakout of the lower line to keep it going. Still in this from 1.4190 with stop at 4160 now. The trendline and 40,50,60 etc levels keep it so ...
The RSI Trade
- andypips replied Apr 26, 2009
backtesting — Hi Paulus. I like what you have shown us here and went to work this evening doing some backtesting. It's manual and not in spreadsheet format so I can't post a shot but have summarised the figures. I tested cable from 25/3 to ...
1 trade a day