- Search Crypto Craft
- 72 Results
-
 ahmed-2014 replied Dec 31, 2015
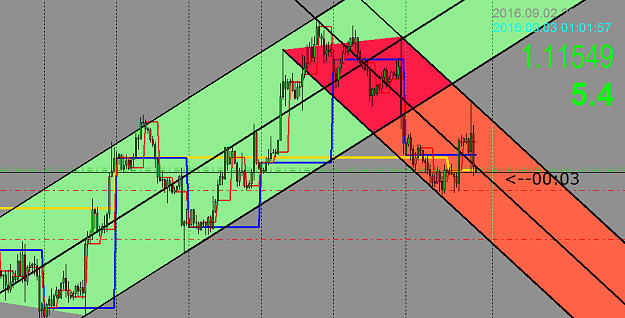
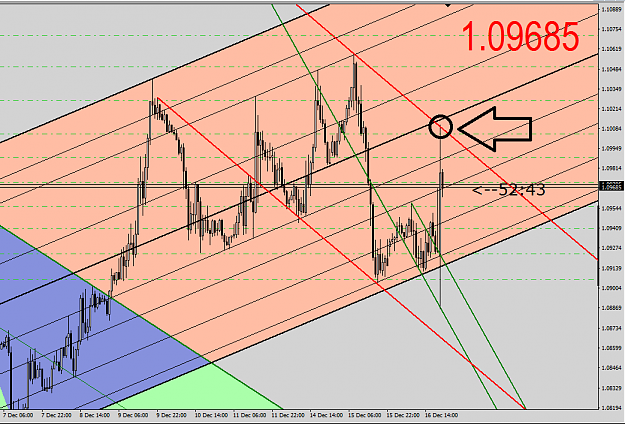
all fundies negative for USD and yet still holding , strange !!!
EURUSD image
image


- ahmed-2014 replied Dec 30, 2015
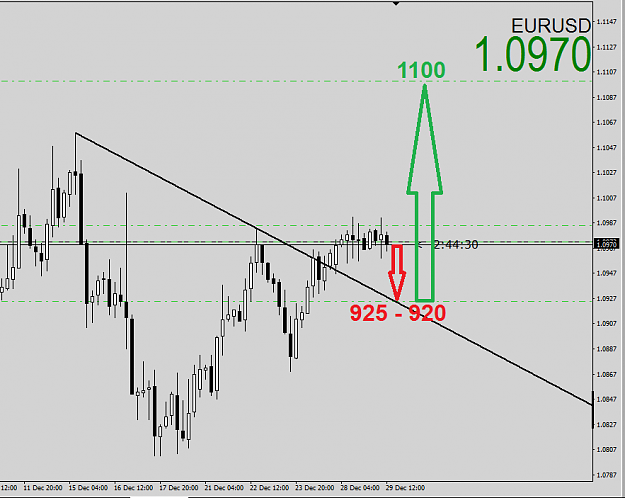
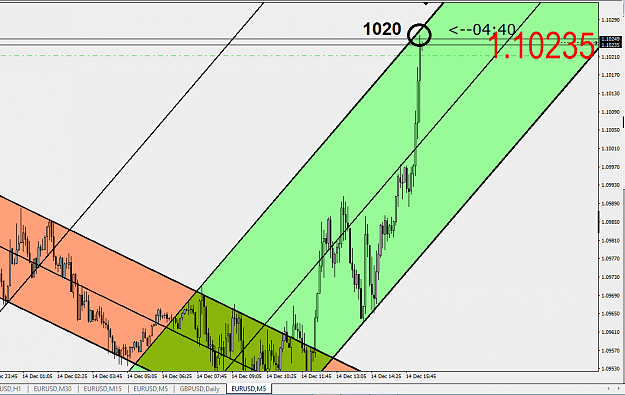
image tomorrow will be decisive with Unemp. no. at NY session if become high this might drive the EU crazy and hit 1100 you can see the expected unemp. is already worse good luck
EURUSD


- ahmed-2014 replied Dec 29, 2015
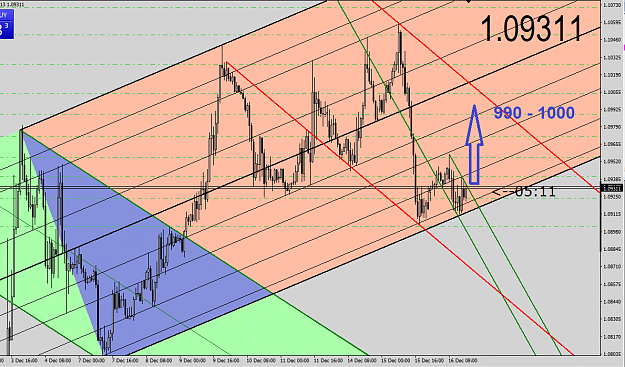
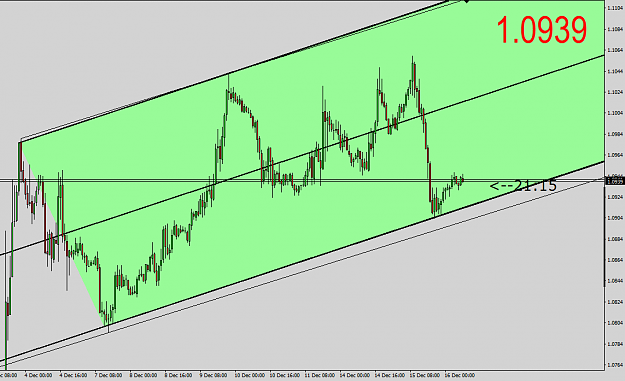
hi everybody i think price may need to retest broken downtrendline @920-925 i will go long again if reached TP@1100 good luck image
EURUSD
- ahmed-2014 replied Dec 22, 2015
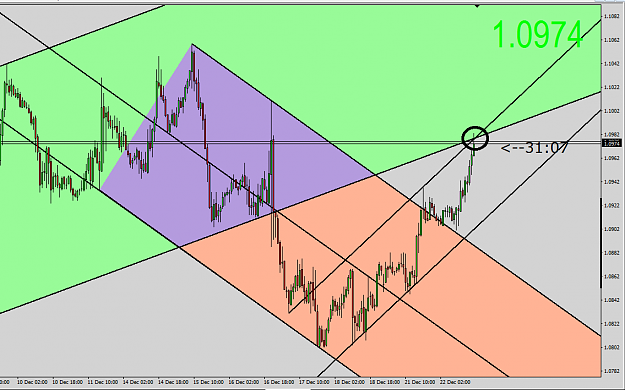
i agree with you EU just retested broken trendline besides , H&S already formed on H4 , members already mentioned that good luck image
EURUSD
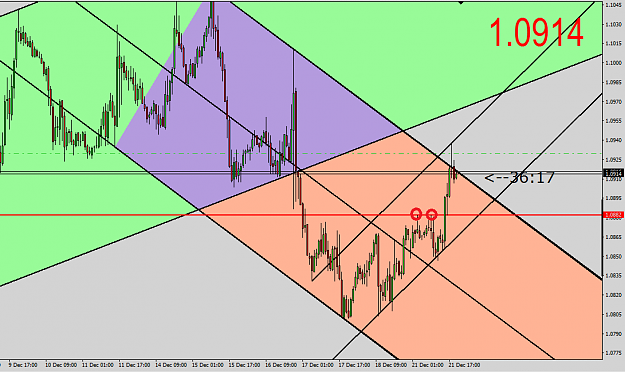
- ahmed-2014 replied Dec 21, 2015
yep no clear close above broken trendline till now choose to stay on the short side for now with tp@850 first important support @882 image
EURUSD
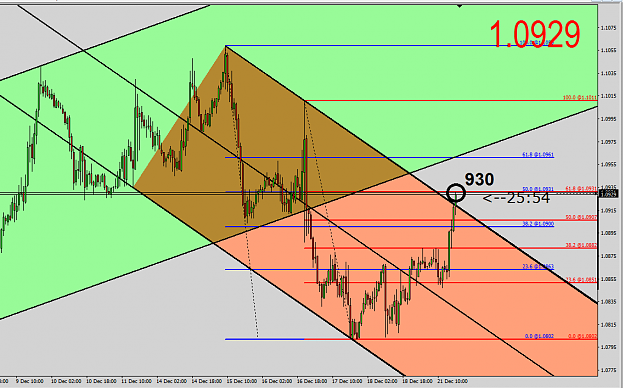
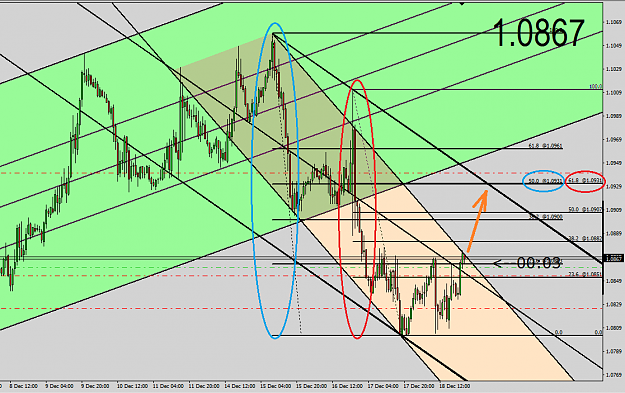
- ahmed-2014 replied Dec 19, 2015
nice chart i think EU might retrace to 930 double bottum is in place @930 50% fib of blue wave 61.8% fib of red wave if reached , could be good chance for shorting EU waiting for bearish channel to break image good luck
EURUSD
- ahmed-2014 replied Dec 16, 2015
not every trader is idiot like him i made the right prediction on that move and i PM it to someone if he don't know whats happening better keep his mouth shut , right ??
EURUSD image look at the price now you KW fool image
- ahmed-2014 replied Dec 14, 2015
come on Goldman Sachs those are my numbers !!!
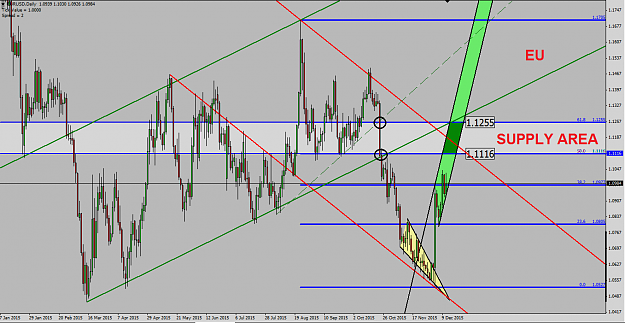
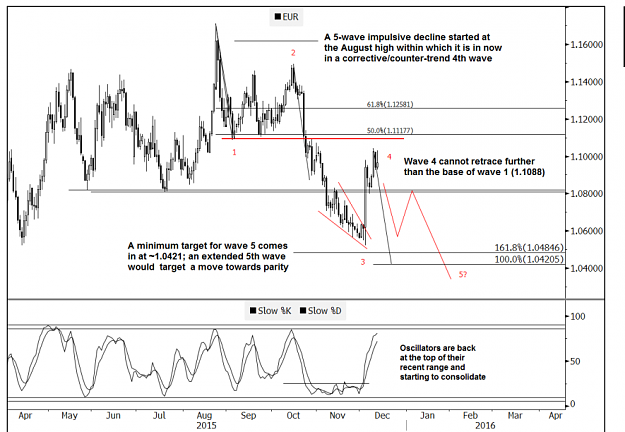
EURUSD Bottom line, it means the market likely put in a meaningful low in November. The next retrace levels above are then at 1.1118 and 1.1258 (50% and 61.8% of the decline since August)," GS concludes. ...
- ahmed-2014 replied Dec 13, 2015
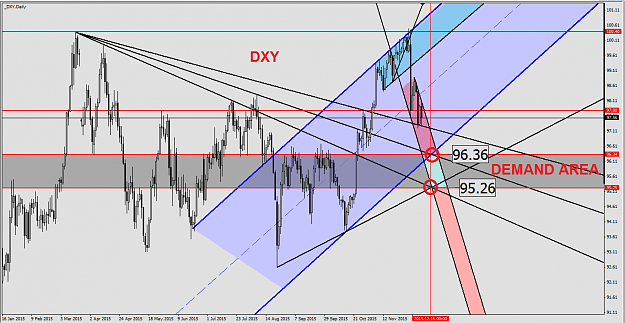
nice charts i consider supply area at EU between these 2 lines @1116 : retest of broken trend + 50% fib + S/R line @1255 : retest of broken trend + 61.8% fib + S/R line image and i will try to synchronize with demand area at DXY image both ...
EURUSD