- Search Crypto Craft
- 10 Results
-
 Wanderer272 replied Feb 22, 2020
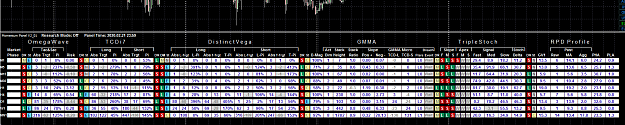
Last but not least, I am also in possession of the holy grail panel. I would like to get back to it one day, otherwise it was a total waste of time. This thing is mega complex w.r.t. coding. Approx 39 files, 20K lines of code. A whopping 434 inputs, ...
Why do traders use so many indicators?
- Wanderer272 replied Feb 22, 2020
In most cases you are right. Patters needs to be seen in context and on on their own are mostly 50/50. Some are fairly reliable though. Spot the pattern: image Anything whatsoever that could provide an edge?
Why do traders use so many indicators?
- Wanderer272 replied Feb 22, 2020
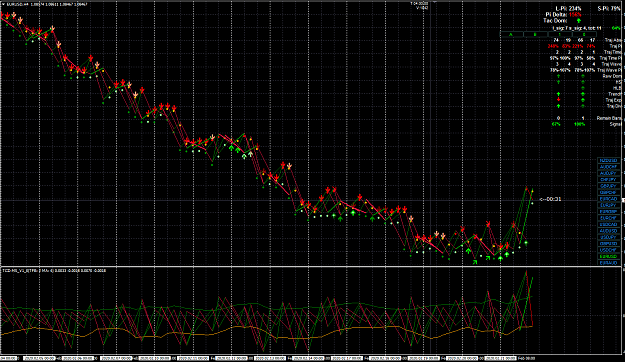
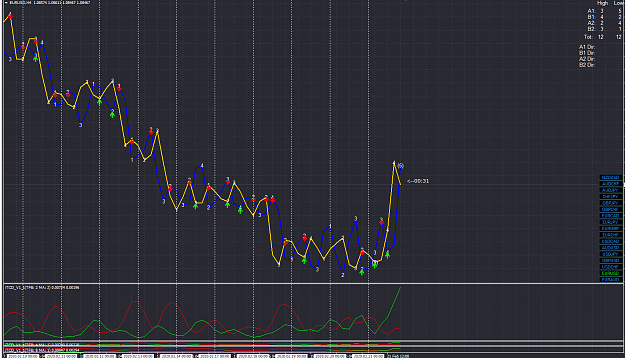
While I am at it, some of my other stuff based on JT's TCD concept: image Another way to look at it: image All of this needs to be integrated through multiple time frames into a coherent whole.
Why do traders use so many indicators?
- Wanderer272 replied Feb 22, 2020
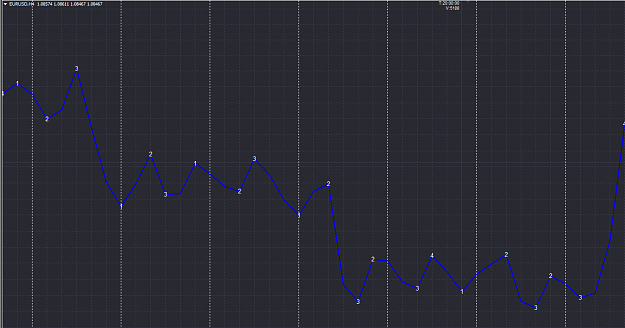
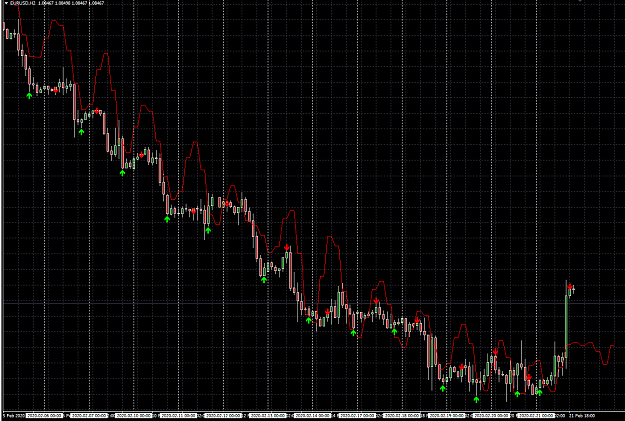
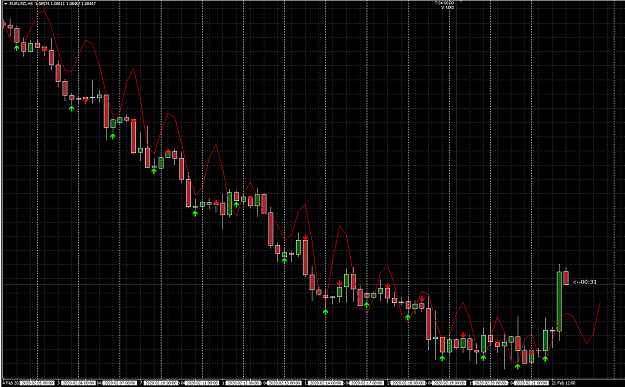
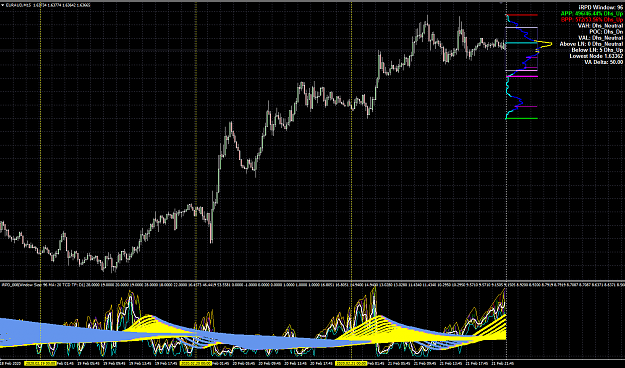
This is the type of cyclic analysis I am working on. I call it the Parabolic Wave. Still a long way to go, but making good progress altogether. Shown here on the EURUSD H4 and H2. It does a fairly good job of capturing the daily cycle: image ...
Why do traders use so many indicators?
- Wanderer272 replied Feb 22, 2020
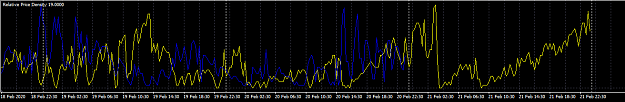
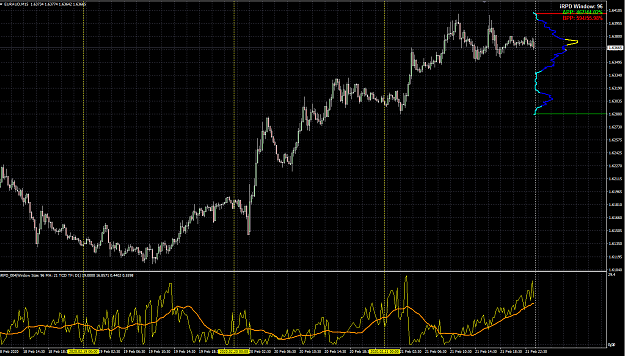
You probably meant to say that I called it Relative Price Density (RPD) Profile. I invented the RPD Oscillator and later added the profile. You did add some stuff to it, to your credit. This is how it evolved: The RPD Oscillator is a linear ...
Auction Market Theory and Market Profile
- Wanderer272 replied Dec 17, 2014
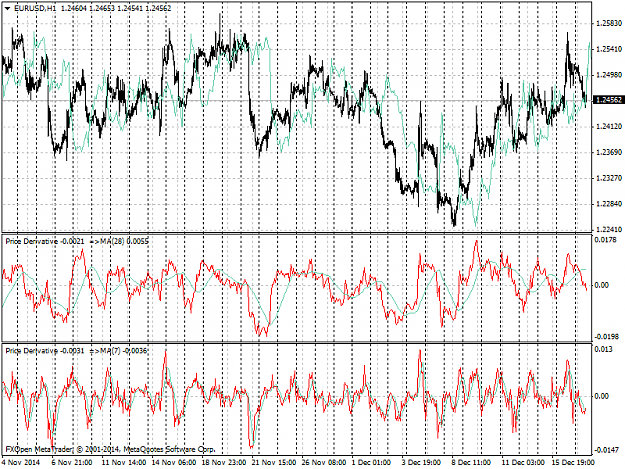
Smoother cycles. I have been bending my brain doing this manually..
Machine Learning with algoTraderJo
- Wanderer272 replied Dec 17, 2014
Thanks, your response makes perfect sense. I agree that there my be some strategies where this may work. I have done extensive research around price cycles. Up to now I have tried to manually find relationships between cycles of various lengths in ...
Machine Learning with algoTraderJo
- Wanderer272 replied Nov 7, 2014
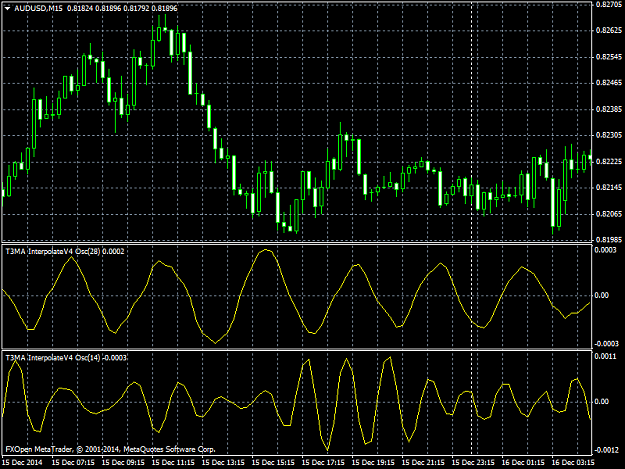
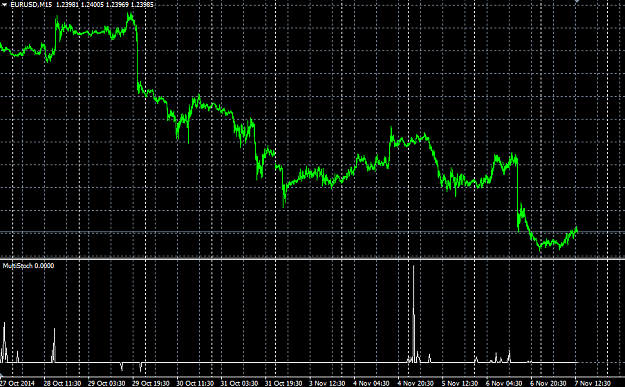
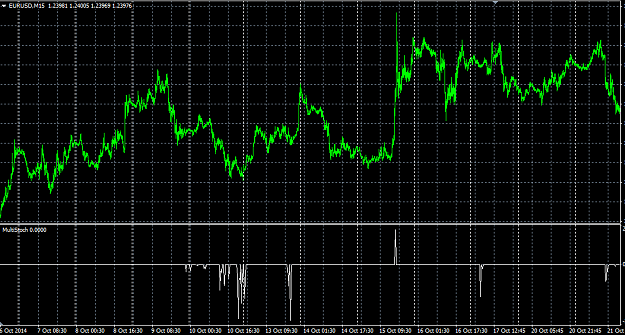
Here is my effort to detect the 15-30 min 400 period wormholes using the 15 min chart only. The one stochastic simply looks back one bar further, due to the cause of the effect as kindly described by kprsa. The line is zero about 95% of the time. I ...
Wormholes - stochastic mismatch system
- Wanderer272 replied Sep 18, 2014
Your equity curve is the output your strategy gives in terms of balance. You will have write it to a file or something similar in order to use it. If you had a 63% win rate first time around, you can increase the overall performance by taking only ...
Statistical mean of the market [quant corner]
- Wanderer272 replied Jan 9, 2013
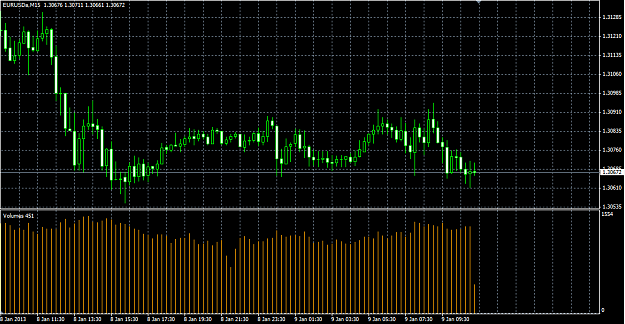
The volumes I get from my broker is totally useless, why would this be? image
Volume Price Level Trading
- Posts by Member Search: 'Wanderer272'