- Search Crypto Craft
- 176 Results (3 Threads , 173 Replies )
-
 Umairs2004 replied Feb 3, 2009
Hi Take a look at the Pic's one by one this is the example of S/R Line's and work's preety well for me on 4-hour chart's
The best support and resistance levels
- Umairs2004 replied Aug 5, 2008
Aud/Usd Weekly Chart!!! — Hammm... Well See it's weekly chart, So Far Aud/Usd already drops for +150 Pip's since from the the start of this week and same as i was expecting... Let's see what will happened Next...
Drawing correct resistance and support-lines
- Umairs2004 replied Aug 1, 2008
Aud/Usd Weekly!!! — Hi Guy's
Drawing correct resistance and support-lines Seems DownFall start's as this pair already breaks the supportline...Let's see...

- Umairs2004 replied Aug 1, 2008
Aud/Usd Weekly!! — Hi Guy's
AUD/USD Seems DownFall start's as this pair already breaks the supportline...Let's see...
- Umairs2004 replied Jul 17, 2008
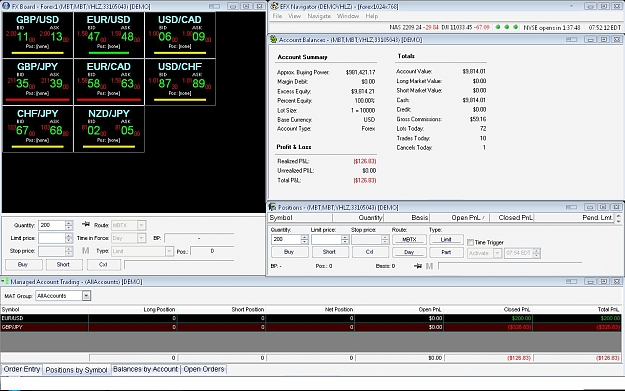
Limit & Stop Order? — JleBlang, I am having some problems with your software regarding limit & stop order. See the screenshot in which i am short in G/J but dont know where & how to place limit & stop order after my position is in the ...
MB Trading Futures - Introduction
- Umairs2004 replied Jul 3, 2008
Gbd/Usd!!! — Thank's Jon
Drawing correct resistance and support-lines Hey BkSujal see this breakout in 4-Hour chart for almost +70/80 Pip's wow it was great chance. Anyways you are using Odl's demo maybe your 4-Hour chart shows different candles formation than My charts coz of ...
- Umairs2004 replied Jul 3, 2008
Placing Support & Resistance Line's in 4-Hour Tf !!! — Placing S/R Lines are as easy as Trendlines. You simply just have to find the highs in your chart's in which market makes it high and than retraces back for atleast 2/3 down candles so ...
Drawing correct resistance and support-lines
- Umairs2004 replied Jul 3, 2008
Hi Jon
Drawing correct resistance and support-lines Thank's for your Patience Well First of all remember reversal candles have a very strong & great impact on higher timeframes like 4-Hours and so on. Now this is a lower time frame(30-Minute). Well i am also a big fan of reversal candles ...
- Umairs2004 replied Jul 1, 2008
Euro/Usd!!! — Hi Guy's
Drawing correct resistance and support-lines See this Euro/Usd Perfect breakUp & My Today's Stuff.
- Umairs2004 replied Jun 30, 2008
Remember I always Use 30-Minutes chart for Trendlines and Also Use 4-Hour chart for S/R Lines + Trendlines also. Now The best possible way to avoide from fakeOut's in a 30-Minutes chart is this that!!! 1) Dont Enter in a same candle which break the ...
Drawing correct resistance and support-lines
![Click to Enlarge
Name: gbd[1]a.gif
Size: 38 KB](/attachment/image/126029/thumbnail?d=1365545726)
- Umairs2004 replied Jun 30, 2008
Usd/Cad 30-Minute — WellDone seems you have drawn this one as a valid trendline on hourly chart. See the same i have drawn in a 30-Minute chart
Drawing correct resistance and support-lines
- Umairs2004 replied Jun 30, 2008
Yepp But see this with different Angle. It was an excellent breakup for some great Pip's
Drawing correct resistance and support-lines
- Umairs2004 replied Jun 30, 2008
Euro/Jpy!!! — But forget to mention about E/J. See it drop's for almost +100 Pip's after a solid breakdown, WoW Seems another breakout day in Lower Time frames.
Drawing correct resistance and support-lines
- Umairs2004 replied Jun 30, 2008
Usd/Jpy!!! — WoW See the same breakout with Usd/Jpy Also. But Missed this One. So far drop's for Almost for +56 Pip's
Drawing correct resistance and support-lines
- Umairs2004 replied Jun 30, 2008
Gbd/Jpy!!! — Hi Guy's i got the good early breakout of Gbd/Jpy for +30 Pip's...See the screenshot.
Drawing correct resistance and support-lines
- Umairs2004 replied Jun 26, 2008
Gbd/Jpy!!! — Wow Guy's a sudden great brearish move is there by G/J For almost +170 Pip's. Anyway's i was very much sure about 213.27 as a strong resistance level now see after breaking this very much strong resistance level G/J Moved up for ...
Drawing correct resistance and support-lines
- Umairs2004 replied Jun 25, 2008
Gbd/Jpy & Gbd/Chf — Hi Guy's... I am keeping an eye on Both these Pair's on higher timeframes... Let's see !!!
Drawing correct resistance and support-lines
- Umairs2004 replied Jun 13, 2008
See The 4-Hour chart. 1.5365 level (Support Line)is already break & after that so far +65 Pip's E/U Dropps so far & i managed to lock mu own Pip's.
Drawing correct resistance and support-lines
- Umairs2004 replied Jun 10, 2008
Woah. You have to accept the losses as well. its a part of this dangerous business. Now see the screenshot with reason why G/J Go against you
Drawing correct resistance and support-lines