- Search Crypto Craft
- 43 Results
-
 ThirtyTen replied Nov 30, 2016
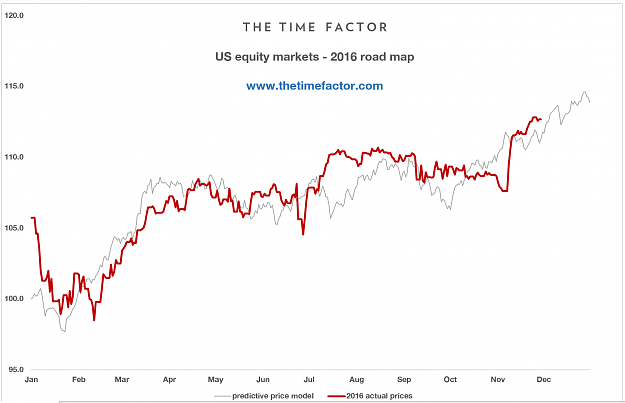
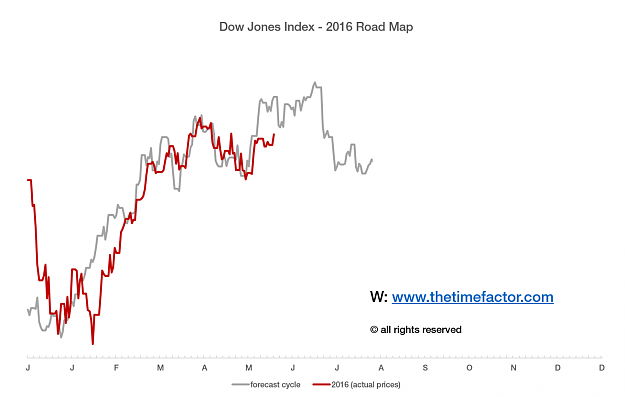
for those who are interested, here is the updated WD Gann Road Map (US equity markets) as of last night. note: the predictive price model was first calculated late in 2015 and has been pretty damn accurate for the entire year.
Carpe diem: Intraday tactics for Dax and Dow
- ThirtyTen replied Nov 4, 2016
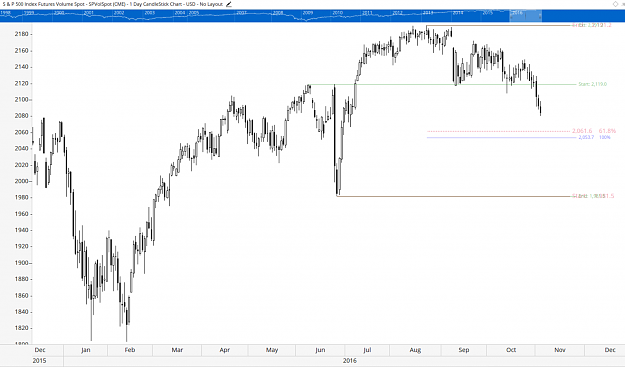
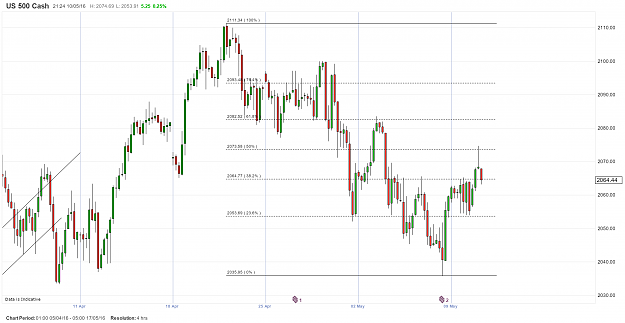
some good price support in the 2050-2060 region for the S&P 500. see attached. article on the ASX 200 for those interested here at the following link. url
Carpe diem: Intraday tactics for Dax and Dow
- ThirtyTen replied Nov 4, 2016
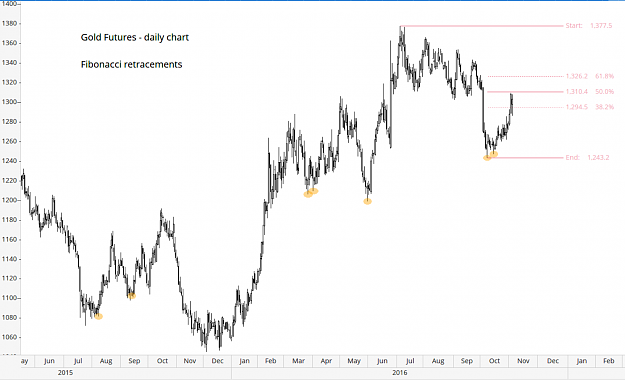
interesting levels on the Fibs to watch for in gold as well.
Only Gold!
- ThirtyTen replied Nov 4, 2016
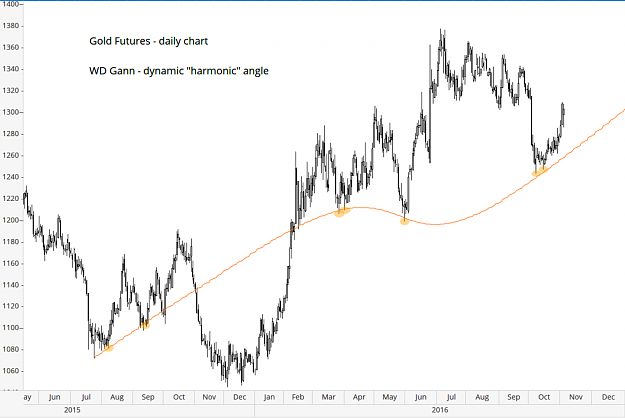
for those interested in Gann theory, here is some analysis on Gold. url
Only Gold!
- ThirtyTen replied Nov 4, 2016
"dynamic" Gann angle working on the gold market (for those interested) url
Gann Analysis

- ThirtyTen replied Jun 7, 2016
there is an increasing possibility that we see equities rally over the next few weeks. the next time series date comes up toward the end of June (say 29th/30th) the Dow Jones is currently following a previous cycle that I have been observing over ...
Carpe diem: Intraday tactics for Dax and Dow
- ThirtyTen replied Jun 1, 2016
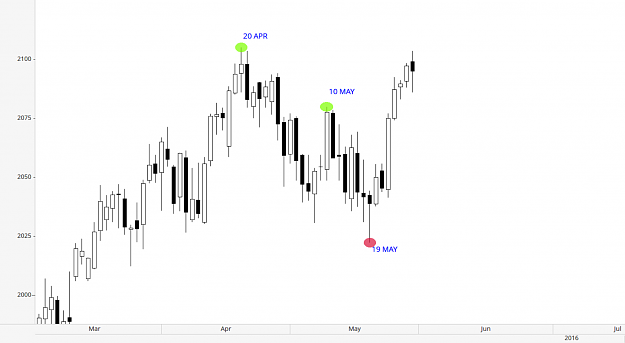
I had the following TIME SERIES date measured in for the SP500 which I provided to a few people on private messages before the event. April - time series was calling for a TOP on either 20/21st August May - I was watching 10/11th May and 18/19th ...
Carpe diem: Intraday tactics for Dax and Dow
- ThirtyTen replied Jun 1, 2016
31 May was the next date in the TIME SERIES sequence for DAX.
Carpe diem: Intraday tactics for Dax and Dow
- ThirtyTen replied Jun 1, 2016
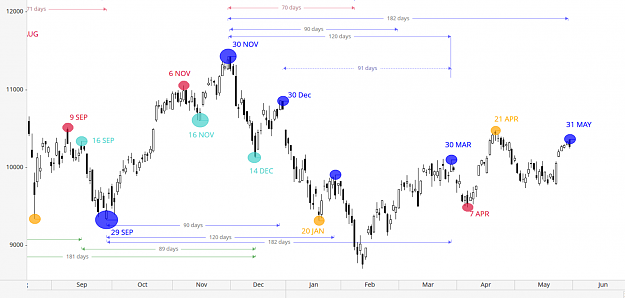
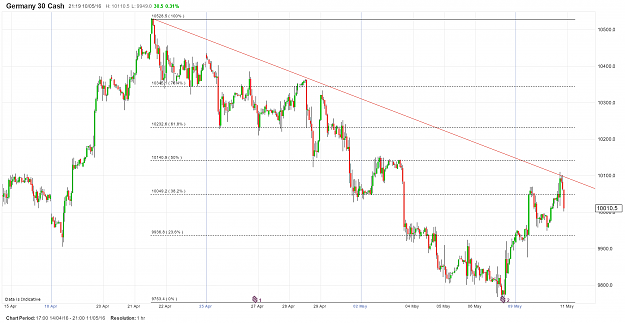
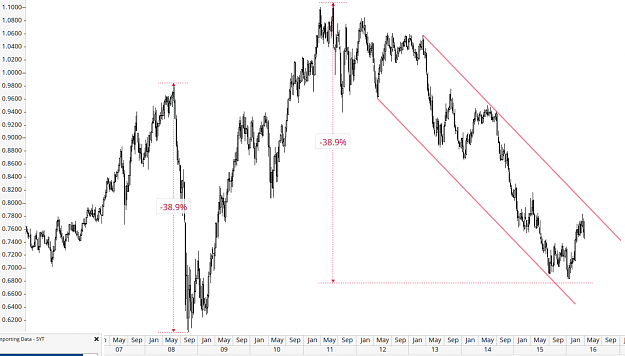
I just posted this chart on another thread, but notice how the traditional Gann 45 degree line, calculated off the TOP in April 2010 has been working in the current market to produce support and resistance points (see blue circles highlighted as ...
Gann Analysis
- ThirtyTen replied Jun 1, 2016
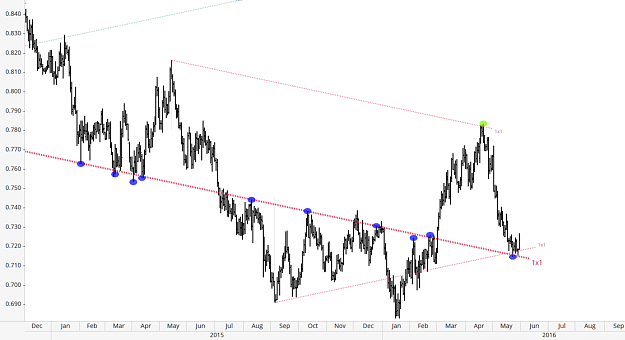
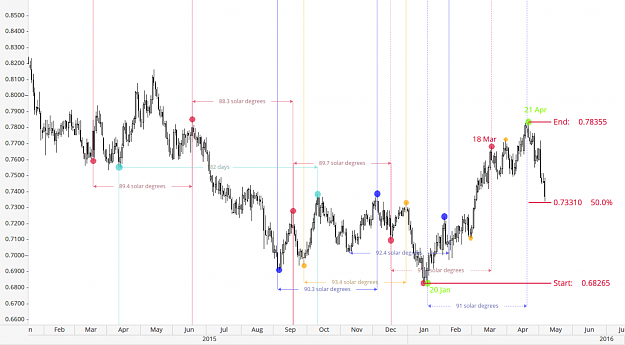
really good example of how the "Gann Angles" work on the currency markets. chart attached has correctly calculated the Gann 45 degree lines (or 1x1 angle) I have highlighted in blue how the 45 degree line from the HIGH back in APRIL 2010 is still ...
AUD/USD

- ThirtyTen replied May 30, 2016
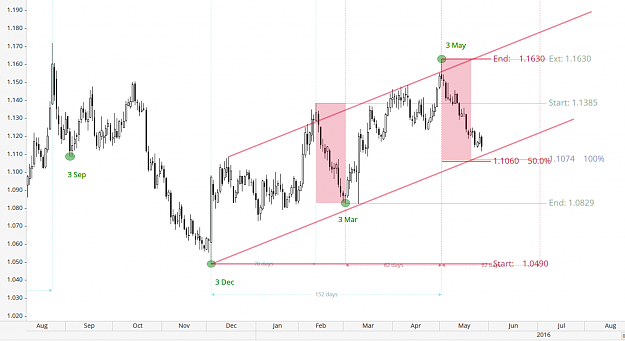
TIME SERIES analysis is suggesting 2nd/3rd June as a possible LOW for the EURUSD. some good price support emerging at 1.1060 to 1.1070 level, so will be watching that zone to see if we get a price bounce
EURUSD
- ThirtyTen replied May 10, 2016
S&P500 has hit 50.0% Fib almost exactly on the cash index. will be interesting to see if we get follow through reversal tonight to the downside...
Carpe diem: Intraday tactics for Dax and Dow
- ThirtyTen replied May 10, 2016
failed to reach 50.0% Fib and has tested trend line resistance on the 1H charts...
Carpe diem: Intraday tactics for Dax and Dow
- ThirtyTen replied May 7, 2016
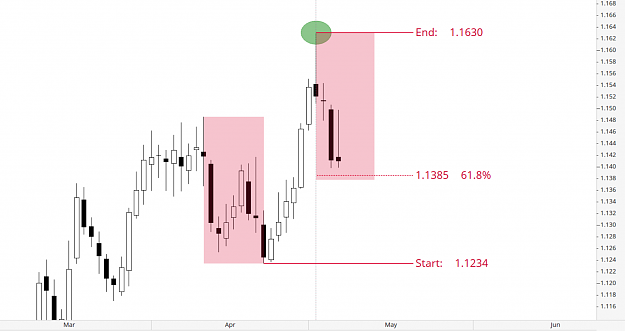
there is a big confluence of support nearing at 1.1380-1.1385 region. 61.8% Fib as well as 100.0% Fib extension (red boxes)
EURUSD
- ThirtyTen replied May 6, 2016
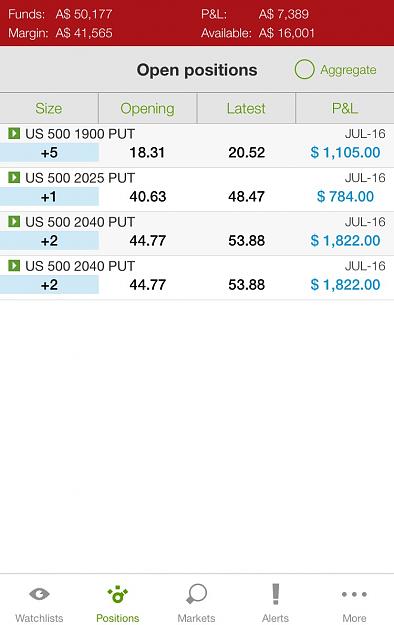
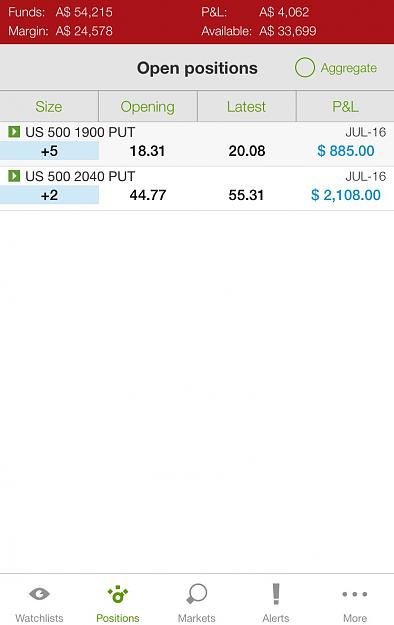
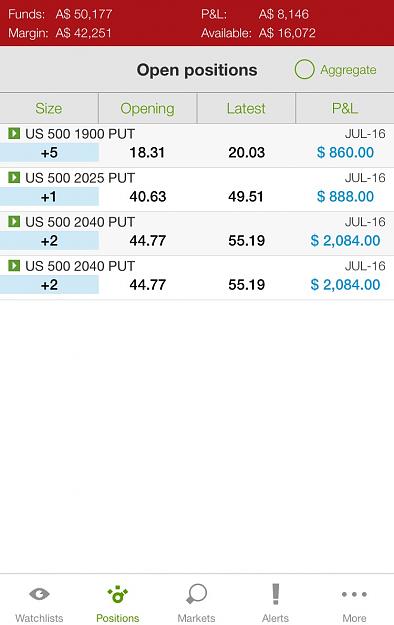
remaining put option positions.
Carpe diem: Intraday tactics for Dax and Dow
- ThirtyTen replied May 6, 2016
have just closed some of the open put option positions on S&P500.
Carpe diem: Intraday tactics for Dax and Dow
- ThirtyTen replied May 5, 2016
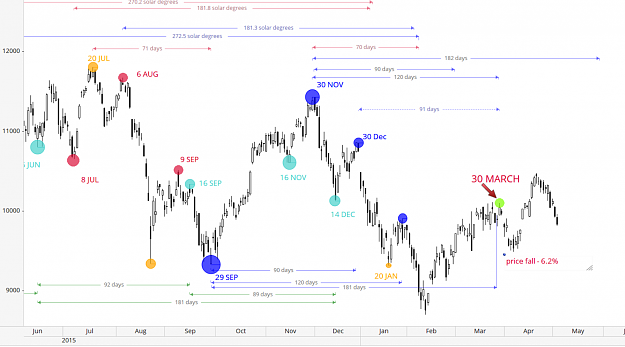
@Decu33 - yes, time series really. Might be worth revisiting an old post on this thread and check the chart that was posted ahead of time (ie why 29/30 March should be an interim high) and compare it to the actual price action where 30 March ...
Carpe diem: Intraday tactics for Dax and Dow
- ThirtyTen replied May 4, 2016
I have had a few people privately ask me about this trade after I outlined that the TIME SERIES was pointing to a top in equity markets on the 20th/21st April. So here it is (my open positions attached). I've also had a few people ask whether the ...
Carpe diem: Intraday tactics for Dax and Dow